
CO is now a very popular name among crypto traders. The Chaikin Oscillator is one of the best indicators used to analyse the strength of a price trend based on trading volume. Though it was originally launched decades ago, this indicator is still widely used in trading, which is enough to explain how much traders love this indicator. Time to delve deeper into understanding this indicator.
1. What’s Chaikin Oscillator
The Chaikin Oscillator is a powerful tool created by Marc Chaikin. Its main job is to keep an eye on how money is flowing in and out of an asset. It does this by checking out the Accumulation/Distribution Line of the Moving Average Convergence Divergence. It is basically a way to see if an asset is getting more love from investors or if they are starting to lose interest.
2. How Does Chaikin Oscillator Works
The Chaikin Oscillator is like the MACD for the Accumulation Distribution Line. The ADL comes from the Close Location Value, comparing high, low and closing prices. If the closing price is below the midpoint, CLV is negative; if above, it is positive. The ADL is the cumulative CLV multiplied by the volume. So, the Chaikin Oscillator predicts changes in the ADL, giving you a heads-up on where the money might be headed in the crypto market.
3. Calculating Chaikin Oscillator: The Simplest Methods
Here is the formula to calculate Chaikin Oscillator:
| N = (Close – Low) – (High – Close) / (High – Low)M = N * Volume (Period)ADL = M (Period – 1) + M (Period)CO = (3-day EMA of ADL) – (10-day EMA of ADL) |
In order to explain this calculation easily, we can break down this into four parts:
- First, find the Money Flow Multiplier (N) using the formula.
- Then, multiply N by the volume to get Money Flow Volume (M).
- Add up M over time to draw the Accumulation Distribution Line (ADL).
- Finally, subtract the 10-day EMA from the 3-day EMA of ADL to cook up the Chaikin Oscillator.
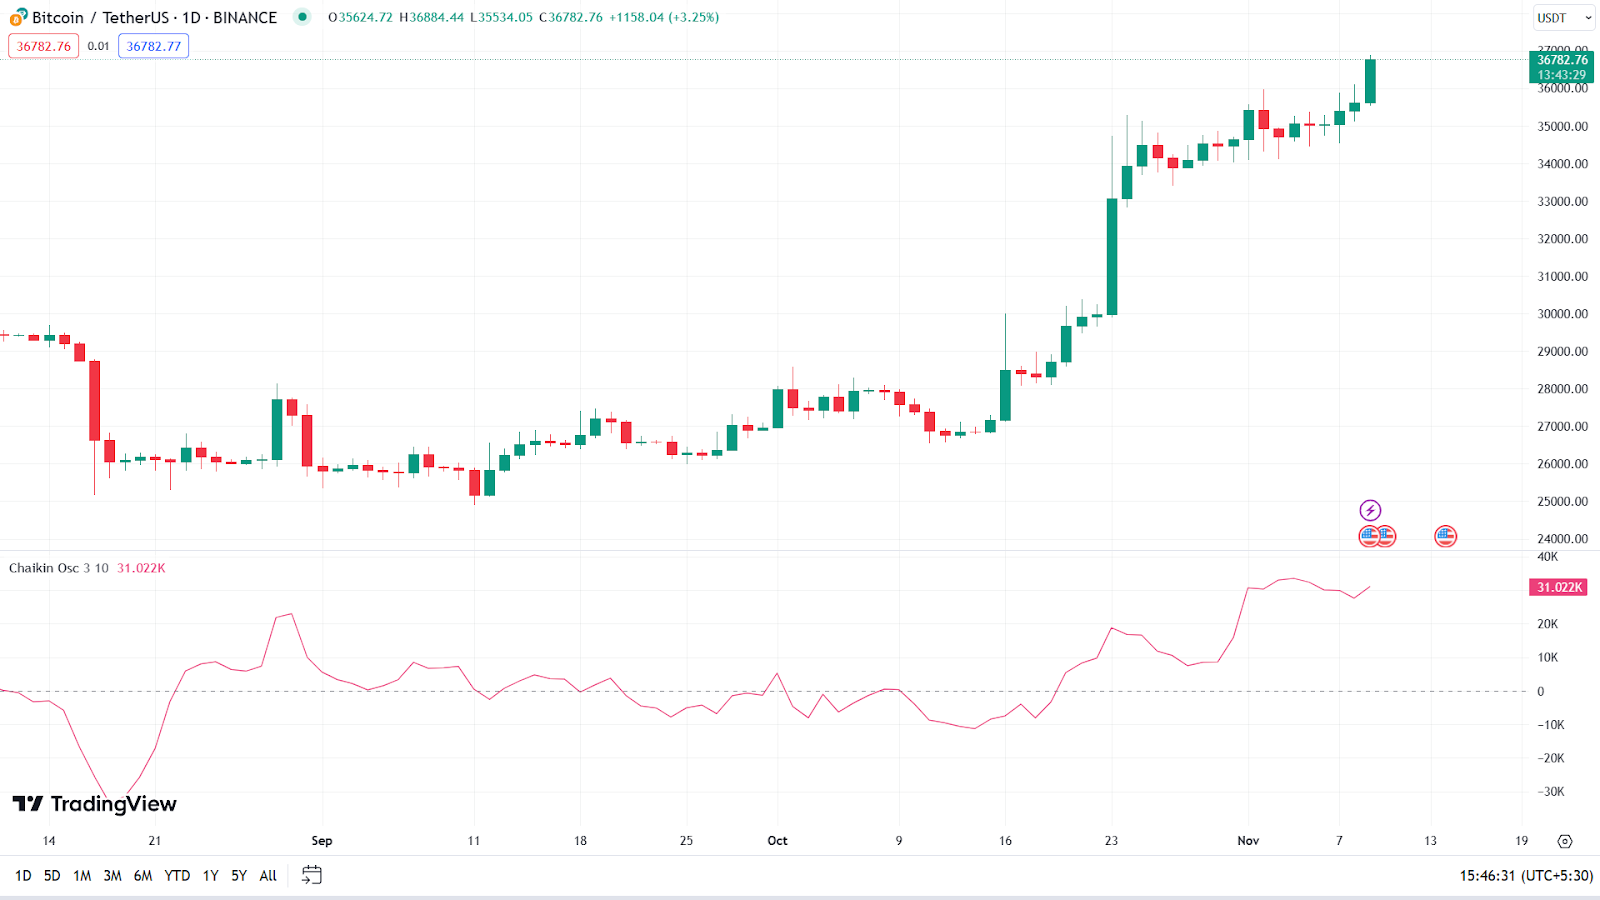
4. Steps to Launch Chaikin Oscillator on a TradingView Chart
Let’s learn how to launch the Chaikin Oscillator indicator on a TradingView Chart. Here are the prime steps to follow:
- Open Tradingview and select the chart you want to analyse.
- Click on the ‘Indicators’ button at the top of the screen.
- Type ‘Chaikin Oscillator’ in the search bar and select it from the list to launch it on your chart.
- You can customise settings if needed, using the settings option.
- Click ‘OK’ to confirm the changes.
- Start analysis.
5. Interpreting Chaikin Oscillator: Learn How to Read
In general, the Chaikin Oscillator indicator gives two signals:
- Bullish Centerline Crossover
When the Chaikin Oscillator crosses above the zero line, it is a sign of potential upward momentum.
If the Chaikin Oscillator’s movement differs positively from the price (when the oscillator is heading up, but prices are not following suit), it suggests a possible upward trend.
- Bearish Centerline Crossover
If the Chaikin Oscillator dips below the zero line, it signals potential downward momentum.
When the Chaikin Oscillator moves differently from the price in a negative way (if the oscillator is on a downward journey, while prices are staying positive), it hints at a potential downward trend.
Endnote
In conclusion, the Chaikin Oscillator, developed by Marc Chaikin, serves as a valuable tool for assessing money flow in and out of assets. It monitors the Accumulation/Distribution Line of the Moving Average Convergence Divergence, aiding investors in measuring market sentiment. This article elucidated its calculation process and provided steps for implementing it on TradingView charts. Interpreting Chaikin Oscillator signals, whether bullish or bearish, offers insights into potential market trends. By understanding and utilising this indicator, traders can make more informed decisions in the dynamic world of digital finance.