
If you are someone who trades a lot, you have probably heard of something called the ‘death cross’ before. Maybe you have wondered why it has got such a scary name. Well, there are folks out there who are curious about this mysterious indicator with its ominous title. This article aims to uncover all the secrets about this indicator. Let’s dive into what it is and how we can use it to improve our cryptocurrency trading. Are you ready?
1. Death Cross: What You Should Know
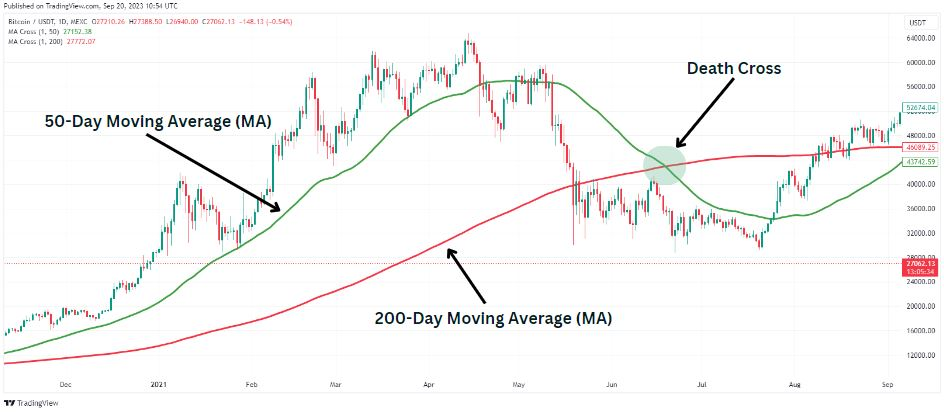
A Death Cross is when a short-term moving average line on a price chart falls below a long-term average line. For instance, if the 50-day average drops under the 200-day one. This signal suggests a potential shift in market trends and is seen as a warning by investors. It is like a red flag indicating possible trouble ahead. Traders often use this information to adjust their strategies, like being cautious on even selling their investments. It is a way for them to prepare for the possibility of the market heading downwards. So, when crypto traders spot a Death Cross, they may take action to protect their investments from potential losses.
1.1. The Psychology Behind the Formation of a Death Cross
The psychology behind the formation of a Death Cross pattern often stems from fear and uncertainty among crypto traders. As the shorter-term moving average crosses below the longer-term one, traders may perceive it as a signal of a significant downtrend, triggering anxiety about potential losses. This fear can intensify as they witness other traders reacting similarly, reinforcing the belief in the pattern’s validity. Confirmation bias plays a crucial role, as traders tend to seek information that supports their existing beliefs while dismissing contradictory evidence. This psychological tendency can lead to exaggerated reactions and hastened selling decisions driven more by emotion than rational analysis.
1.2. Factors That Influences The Death Cross Formation
There are several factors that influence the formation of a Death Cross pattern. The prominent ones are market volatility, economic indicators, geopolitical events, and many more.
Market volatility, inherent to cryptocurrencies, can signal rapid shifts in investor sentiment. Economic indicators, like adoption rates or regulatory developments, can impact market dynamics. Geopolitical events, such as government crackdowns or global regulatory changes, can trigger significant market reactions.
2. The Best Way to Spot a Death Cross in a Crypto Chart
Here is a simple step-by-step guide to easily spot a Death Cross:
- Look for two moving averages on the chart – a shorter-term one (like 50-day) and a longer-term one (like 200-day).
- Observe where the shorter-term moving average crosses below the longer-term moving average.
- Do visual confirmation. The short-term line should clearly dip below the longer-term line.
- Ensure this crossover is sustained for a meaningful period, typically several days.
- Check if the volume of trading supports the Death Cross formation, indicating strong selling pressure.
- Analyse broader market conditions and news to confirm the significance of the Death Cross.
3. The Simplest Death Cross Trading Strategy
Here is the most popular, simplest death cross trading strategy:
- Identification of Death Cross
Observe when the shorter-term moving average (e.g., 50-day) crosses below the longer-term moving average (e.g., 200-day) on the crypto chart.
Initiate a short position (selling) as soon as the Death Cross is confirmed, indicating a potential downtrend in the market sentiment.
Set a stop-loss order slightly above the recent swing high or a resistance level to limit potential losses if the trade goes against expectations.
Determine a profit target based on previous support levels, Fibonacci retracement levels, or a predefined risk-reward ratio.
Monitor trading volume to validate the strength of the Death Cross signal and adjust position size accordingly to manage risk exposure.
Exit the trade either when the profit target is reached or if there are signs of a bullish reversal, such as the shorter-term moving average crossing back above the longer-term one.
4. Top Five Advanced Death Cross Trading Strategies
The top five advanced death cross trading strategies are:
- Dynamic Moving Average Crossover
Adapts moving average periods based on market volatility. Longer periods are used in volatile markets to filter out noise and provide smoother signals, while shorter periods are employed in stable markets for capturing short-term trends and avoiding lagging behind significant price movements.
- Volume Confirmation Strategy
Requires high trading volume to confirm the Death Cross signal. Traders wait for significant volume spikes during the crossover, validating increased selling pressure and strengthening the signal’s reliability.
- Multiple Timeframe Analysis
Confirms Death Cross signals by analysing multiple timeframes. Traders seek alignment of Death Crosses across different timeframes, enhancing the signal’s reliability and providing clearer entry and exit points.
- Divergence Analysis Approach
Considers divergences between price and the Death Cross signal. Traders look for instances where price fails to confirm the Death Cross, signalling potential reversal opportunities or weaker downtrends.
- Combination with Oscillators
Intergate Death Cross signals with oscillators like RSI or MACD for confirmation. Traders use oscillator readings to gauge oversold conditions and avoid entering short positions when markets are excessively bearish.
5. Difference B/W Death Cross & Golden Cross
Here is the comparison between the death cross and golden cross.
| Aspects | Death Cross | Golden Cross |
| Definition | Short-term moving average crosses below long-term average, signalling a bearish trend. | Short-term average crosses above long-term average, indicating a bullish trend. |
| Market Sentiment | Bearish sentiment, potential downtrend. | Bullish sentiment, potential uptrend. |
| Signal Interpretation | Suggests selling or shorting opportunities. | Indicates buying or long positions. |
| Timeframe Variation | Typically uses longer-term averages for reliability. | Can involve shorter-term averages for more frequent signals. |
| Signal Frequency | Less frequent but more reliable. | More frequent but may generate false signals. |
6. Disadvantages of Death Cross Patterns
Here are the prime disadvantages of a Death Cross pattern.
Occasional occurrences of incorrect signals may lead to whipsaw movements and losses for crypto traders.
Confirming trends after they have already begun may result in delayed entry or exit points.
Depending solely on the Death Cross overlooks other market factors, increasing the risk of misinterpretation.
Endnote
In conclusion, while the Death Cross serves as a valuable tool for identifying potential shifts in market sentiment, traders should approach its signals with caution. Understanding its psychological underpinnings, implementing effective confirmation strategies, and considering broader market dynamics are crucial for mitigating risks associated with false signals and lagging indicators. Integrating the Death Cross into a comprehensive trading approach, supplemented with prudent risk management and through analysis, can enhance decision-making and improve overall trading outcomes in the dynamic landscape of cryptocurrency markets.
Disclaimer and Risk Warning
The information provided in this content by Coinpedia Academy is for general knowledge and educational purpose only. It is not financial, professional or legal advice, and does not endorse any specific product or service. The organization is not responsible for any losses you may experience. And, Creators own the copyright for images and videos used. If you find any of the contents published inappropriate, please feel free to inform us.