
Navigating price action in crypto trading can be challenging due to its complexity. To simplify the process, incorporating powerful indicators becomes crucial. Among these, Ichimoku stands out for its effectiveness in enhancing clarity. This indicator excels in deciphering primary trends, identifying support and resistance levels, and providing insights into market reversals. Its prowess lies in rendering price action more accessible and comprehensible. In this article, we will delve into the art of ‘Trading Price Action with Ichimoku Clouds.’ By understanding how to apply this indicator to charts, traders can gain a clearer perspective on market dynamics, facilitating informed decision-making. Are you ready to explore the nuances of leveraging Ichimoku Clouds for a more insightful approach to price action trading?
1. Ichimoku Clouds: What’s It
Ichimoku Clouds amalgamates various technical indicators into a single chart, offering a comprehensive analysis of market dynamics. Comprising five past averages, this moving average-based indicator strategically positions them on the chart. It unveils crucial insights into potential support and resistance levels, market momentum, and trends. Widely embraced by crypto traders, it serves as a potent forecasting tool.
2. How Does Ichimoku Cloud Works
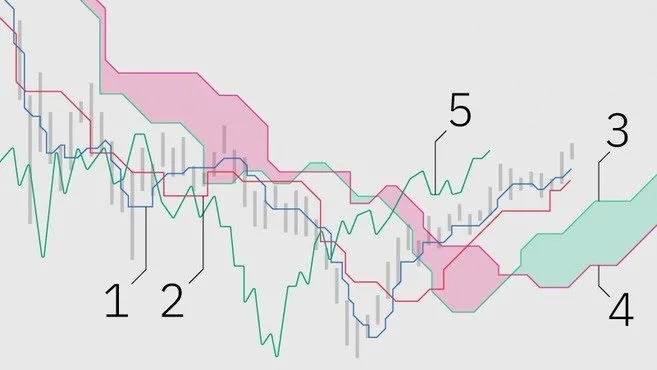
The Ichimoku Cloud indicator combines leading and lagging indicators on a chart. Its innovative use of high and low points, rather than closing prices, set it apart. Consisting of five lines, including Conversion Line, Base Line, Leading Span A, Leading Span B, and Lagging Span, the indicator offers insights into market trends, support and resistance levels, and forecasting.
Conversion Line (Tenkan-sen): is calculated using a 9-period moving average of high and low prices. It appears as a line on the chart, offering insights into short-term price trends.
Base Line (Kijun-sen): is computed with a 26-period moving average of high and low prices. It appears as another line, providing a medium-term trend perspective.
Leading Span A (Senkou Span A): is formed by projecting the average of Conversion and Base Lines 26 periods into the future. It appears as a cloud, indicating future support or resistance levels.
Leading Span B (Senkou Span B): is created with a 52-period moving average projected 26 periods into the future. It appears as a second cloud, offering additional insights into potential future market movements.
Lagging Span (Chikou Span): reflects the closing price of the current period projected 26 periods into the past. It appears as a line, providing a lagging perspective on historical price action.
The settings of 9, 26 and 52 periods reflect the original design of Japanese journalist Goichi Hosoda, the creator of the indicator, aligning with Japan’s business schedule. In crypto trading, traders often customise these settings to fit the 24/7 markets, enhancing adaptability.
For instance, imagine an Ichimoku Cloud chart displaying a green cloud above a red one. The Leading Span A (green) is projected higher than Leading Span B (red), indicating a bullish trend. This scenario signifies potential upward market momentum and serves as a visual guide for traders. Conversely, a red cloud above a green one suggests a bearish trend, guiding traders to anticipate potential downward movements.
3. Price Action Explained
In crypto trading, price action involves analysing and interpreting the movement of cryptocurrency prices on charts. Crypto traders use this method to make decisions based on historical price patterns, trends, and key support/resistance levels, without relying on traditional indicators. It emphasises understanding market sentiment.
4. Best Strategies to Trade Using Ichimoku Cloud and Price Action
Here are the prominent strategies:
- Ichimoku Price Rejection
Combine Ichimoku Cloud analysis with price rejection signals. Look for price rejections at key Ichimoku levels, such as the cloud or Tenkan-Sen/Kijun-Sen. A bullish rejection at support levels may indicate a buy signal, while a bearish rejection at resistance levels may signal a sell. This strategy merges the precision of Ichimoku with the nuanced insights of price action.
- Inside Bar Breakout with Kumo Confirmation
Identify inside bars within the Ichimoku Cloud. Execute trades when the price breaks out of the inside bar, using the cloud as a confirmation of the breakout direction. This strategy combines the simplicity of inside bar patterns with the robustness of Ichimoku Cloud analysis.
- Ichimoku Fibonacci Retracement
Apply Fibonacci retracement levels to key Ichimoku components, like the cloud or Tenkan-Sen/Kijun-Sen. Look for confluence between Fibonacci levels and Ichimoku structures to identify potential reversal or continuation zones. This strategy combines the precision of Fibonacci analysis with Ichimoku’s trend-following capabilities.
- Price Action Inside the Cloud
Focus on price action occurring within the Ichimoku Cloud. Analyse candlestick patterns and key support/resistance levels within the cloud to identify potential trend continuation or reversal signals. This strategy emphasises the importance of understanding price dynamics within the cloud.
- Ichimoku Breakout and Engulfing Candle
Combine Ichimoku Cloud breakout signals with the power of engulfing candle patterns. Wait for a breakout above the cloud and confirm it with a bullish engulfing candle, or vice versa for a bearish scenario. This strategy integrates the Ichimoku’s trend confirmation with the compelling reversal signals provided by engulfing candles.
- Ichimoku Support/Resistance Flip
Identify key support and resistance levels within the Ichimoku Cloud. Trade the trend continuation or reversal when the levels flip roles. For instance, a previous resistance turning into support signals a potential bullish entry. This strategy intertwines the principles of price action’s support/resistance dynamics with Ichimoku’s trend analysis.
- Ichimoku Tenkan-Sen Bounce
Focus on the interaction between price and the Tenkan-sen. Look for bounces off the Tenkan-Sen as potential entry points. A bullish bounce off the Tenkan-Sen could signal a buying opportunity, while a bearish bounce may indicate a selling opportunity. This strategy incorporates the principles of price action and Ichimoku.
- Price Action Inside Kumo Twist
Monitor price action within the Kumo (cloud) and observe for twists or change in its structure. Execute trades based on candlestick patterns or price reactions within the cloud, especially during a twist. A bullish twist followed by positive price action may signal a buy, while a bearish twist with corresponding bearish price action could indicate a sell. This strategy combines the nuances of price action with the cloud’s dynamic trend information for precise entry and exit points.
5. Advanced Way to Use Ichimoku Cloud with Price Action
In crypto trading, combining Ichimoku Cloud with Price Action in an advanced approach involves integrating fractals. Fractals, indicating short-term extremes with Up (blue) and Down (red) arrows, highlight turning points around major support or resistance. By aligning with Ichimoku rules and recognising rejection of price action at key chart levels, crypto traders gain confidence in anticipating trend reversals. Utilising this advanced strategy helps identify potential trend shifts, providing traders with high-probability entry points. Fractals serve as valuable tools, signalling when prices above the cloud cease falling, allowing trades to capture favourable uptrend rebounds.
For instance, suppose you are trading a cryptocurrency using Ichimoku Cloud and Price Action. You see a blue arrow (Up Fractal) on the chart, indicating a highest high in the highlighted area. This aligns with Ichimoku rules, signalling a potential turning point around crucial support. Recognising the rejection of lower prices, you gain confidence in an uptrend rebound. The Fractal serves as a helpful indicator, suggesting that the cryptocurrency has likely stopped falling above the cloud. This advanced strategy enables you to enter trades at high-probability points.
Endnote
Mastering the art of trading price action with Ichimoku Clouds provides crypto enthusiasts with a powerful toolkit for navigating the complexities of the market. This comprehensive indicator, with its unique amalgamation of moving averages, not only enhances clarity but also offers valuable insights into trends, support and resistance levels, and potential reversals. By combining Ichimoku Cloud analysis with strategic price action techniques, traders can deploy a range of effective strategies, from trend confirmation to precise entry and exit points. The advanced integration of fractals further elevates this approach, empowering traders with high-probability signals for anticipating trend shifts. Embracing the nuances of Ichimoku Cloud trading opens doors to informed decision-making and increased success in the dynamic world of crypto trading.
Disclaimer and Risk Warning
The information provided in this content by Coinpedia Academy is for general knowledge and educational purpose only. It is not financial, professional or legal advice, and does not endorse any specific product or service. The organization is not responsible for any losses you may experience. And, Creators own the copyright for images and videos used. If you find any of the contents published inappropriate, please feel free to inform us.