
Candlestick patterns are a powerful tool in crypto trading. They are highly popular among professional traders active in the crypto market. These patterns were developed back in the 16th century in Japan and so are time-tested and highly valuable. Crypto traders generally use these patterns to analyse market sentiment and price movement dynamics. It is time to get a basic idea about Candlestick patterns. Let’s start!
1. What’re Candlesticks
Imagine candlesticks in crypto trading as a graphic storyteller, revealing the ongoing battle between buyers and sellers each day or each period – each period implies each hour in an hourly chart, each week in a weekly chart and so on. Each candle captures a period’s drama, where a light candle (green or white) signals victory for the buyers, while a dark one (red or black) marks success for the sellers. In short, each candlestick holds all the news, date, and price action of the period.
1.1. The Anatomy of a Candlestick
A candlestick has four parts: the open (start), close (end), high (highest point), and low (lowest point) prices.
The space between open and close is the body, and its colour tells if it is a good or bad day – green for gains, red for losses. Meanwhile, the body’s size shows how strong the day’s move was.
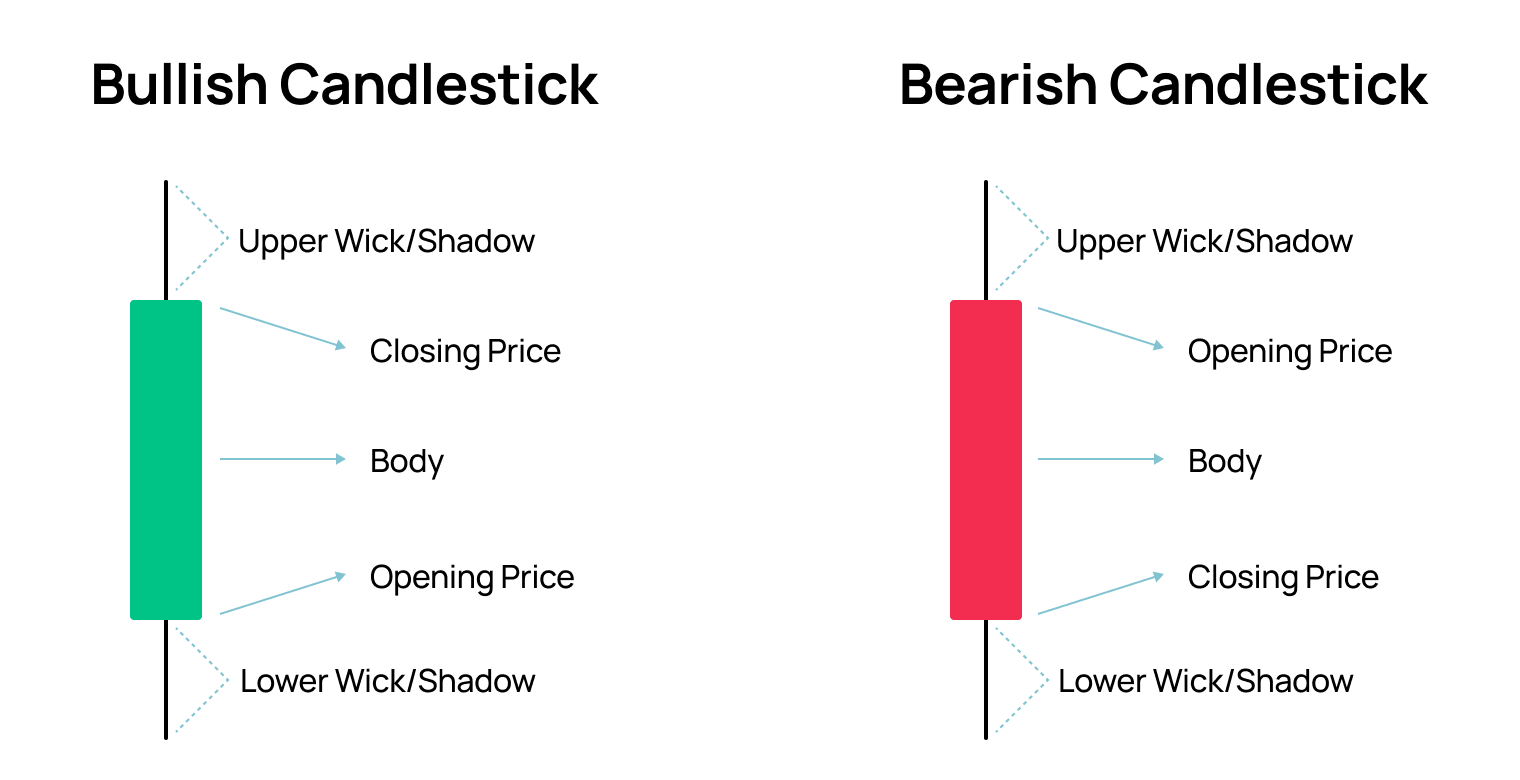
The wick of a candlestick is as important as its body. The upper shadow or wick is the thin line from the top of the body to the highest point, and the lower shadow or wick is the line from the bottom of the body to the lowest point.
If the upper shadow is long, it means prices tend to soar but faced resistance or profit-taking. If short, it implies buyers ruled the period.
Likewise, if the lower shadow is long, it suggests that prices dropped significantly but found support or buying interest near the bottom. If short, it implies that sellers dominated the day, pushing prices lower without much resistance.
2. What’re Candlestick Patterns
Candlestick patterns are like secret codes in crypto charts, formed by combining individual candlesticks. While a single candlestick tells a period’s story, patterns emerge when these candles team up. Each pattern signifies a potential market move, like bullish trends or bearish signals.
3. Two Primary Types of Candlestick Patterns
There are two primary types of candlestick patterns: Bullish and Bearish.
- Bullish Candlestick Patterns
Bullish candlestick patterns suggest that the price is likely to go up. They often indicate a potential buying opportunity.
Hammer and Bullish Engulfing Pattern are among the popular bullish candlestick patterns.
- Bearish Candlestick Patterns
Bearish candlestick patterns indicate a potential downward movement in prices. They are often seen as signals to sell or avoid buying.
Shooting Star and Evening Start are among the popular bearish candlestick patterns.
4. Five Popular Candlestick Patterns
Hammer, Engulfing, Shooting Star, Evening Star and Doji are the five most popular candlestick patterns in the world of crypto trading.
The Hammer is a bullish reversal pattern that forms after a downtrend. It has a small body near the top of the candlestick and a long lower shadow.
It signifies that sellers were initially in control but the buyers stepped in, pushing the price up.
Unlike other popular ones, there are two types of engulfing patterns: Bullish and Bearish. Both offer different interpretations.
A small candlestick (can be bearish or bullish) is followed by a larger bullish candlestick that completely engulfs the smaller one.
This means that after a period of uncertainty or minor pullback, the buyers have stepped in strongly, suggesting a potential upward trend.
A small candlestick (can be bearish or bullish) is followed by a larger bearish candlestick that completely engulfs the smaller one.
This implies that after a period of uncertainty or a minor rally, the sellers have stepped in strongly, indicating a potential downward trend.
The Shooting Start is a bearish reversal pattern that appears after an uptrend. It has a small body near the bottom of the candlestick and a long upper shadow.
It suggests that buyers attempted to push the price higher but failed, signalling a potential reversal.
The Evening Start is a bearish reversal pattern that consists of three candles. It starts with a large bullish candle, followed by a small bullish or bearish candle, and ends with a large bearish candle.
The first large bullish candle represents strong buying and a prevailing uptrend. The second small-bodied candle reflects uncertainty or a potential loss of momentum. The third large bearish candle indicates that sellers have taken control. This pattern indicates a possible trend reversal from bullish to bearish.
A Doji is a candlestick with a small body, where the opening and closing prices are very close or equal. It has upper and lower shadows of varying lengths.
It suggests that neither the buyers nor the sellers are in control, leading to a potential reversal or continuation of the trend depending on the context.
Endnote
Understanding candlesticks and their patterns is essential for informed decision-making in crypto trading. As visual narratives of market dynamics, these candlestick formations serve as invaluable tools for traders, offering insights into potential shifts in buyer-seller dynamics. Whether identifying bullish opportunities with patterns like the Hammer or recognising bearish signals through the Evening Start, mastering these visual cues enhances one’s ability to navigate the complex landscape of cryptocurrency markets. Stay vigilant, stay informed, and let the language of candlesticks guide your trading strategies.
Disclaimer and Risk Warning
The information provided in this content by Coinpedia Academy is for general knowledge and educational purpose only. It is not financial, professional or legal advice, and does not endorse any specific product or service. The organization is not responsible for any losses you may experience. And, Creators own the copyright for images and videos used. If you find any of the contents published inappropriate, please feel free to inform us.