
There is a common misconception among crypto traders that technical indicators, which rely on complex concepts, yield better results than those based on simple ideas. You might also share a similar perspective. However, it is essential to understand that it is often beneficial to work with indicators whose concepts are simple and easy to grasp. If you don’t fully comprehend how an indicator works, it might not give you the results you are hoping for.
Let’s explore a highly effective indicator that originates from a simple concept, Bollinger Bands.
1. What is Bollinger Band in Crypto Trading
Bollinger Bands are primarily a tool to measure how much prices are swinging around in the market. They consist of three lines that create a channel around the price movements. Invented by John Bollinger in the 1980s, it is mainly used to analyse market trends, apart from volatility.
2. Three Bands in Bollinger Band
It is important for you to learn deeply about the three bands of Bollinger Band.
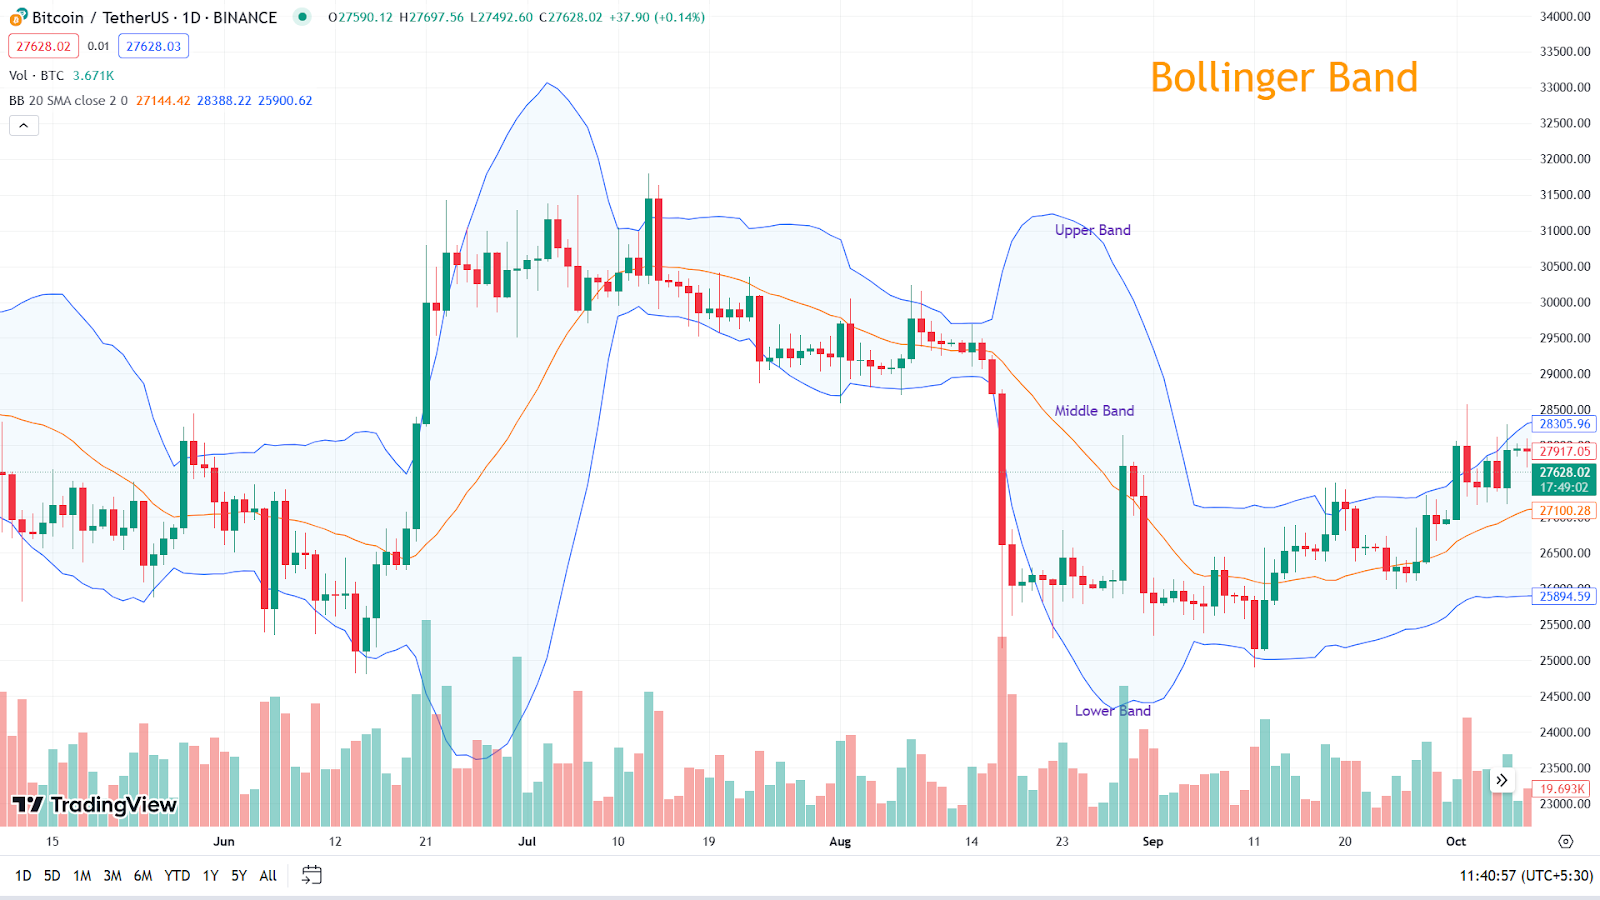
Let’s start with the middleone. It is a simple moving average – usually a twenty-day SMA. The other two bands are located two standard deviations away from the Middle Band. The Upper Band is calculated by adding two standard deviations to the SMA, while the Lower Band is determined by subtracting two standard deviations from the SMA.
Now, let’s move towards the calculation part.
3. Calculating Bollinger Band
The calculation part of Bollinger Band is simple.
| The Middle Band = 20 Day Simple Moving Average The Upper Band = 20 Day SMA + (Standard Deviation * 2) The Lower Band = 20 Day SMA – (Standard Deviation * 2) |
3.1. Standard Deviation in Bollinger Band: What’s It
The standard deviation in Bollinger Band measures the price’s dispersion or how spread out it is from the 20-day SMA. It helps identify volatility; a higher standard deviation means greater price swings, while a lower one suggests stability.
4. Steps to Launch Bollinger Band on A Chart in TradingView
Here are the simple steps to launch Bollinger Bands on a chart in TradingView.
- Step 1: Sign In to TradingView
Log in to your TradingView account. If you don’t have one, create it.
- Step 2: Launch a Chart
Search for a cryptocurrency trading pair or a crypto to open a chart.
Click on the ‘indicator’ button at the top of the chart.
- Step 4: Search for Bollinger Bands
Type ‘Bollinger Bands’ in the search bar.
- Step 5: Select Bollinger Band
Click on ‘Bollinger Band’ from the list of results. You might find several variations of Bollinger Band. Better start with this one.
- Step 6: Configure Bollinger Bands
Adjust settings like length and standard deviation. Better to use the default settings as it is; i.e., 20 for length and 2 for standard deviation.
Click the ‘OK’ button to add Bollinger Bands to your chart.
5. What Do Bollinger Bands Tell You
Bollinger Bands are used to predict future price movements of a cryptocurrency or asset.
Generally, when the price of an asset touches the Upper Band, it is considered as an overbought scenario; when meets the Lower Band, as an oversold scenario.
The possibility of this indicator is tremendous. You can use this in many innovative ways. Like other similar indicators, you can also customise this indicator the way you want.
Here are the two other popular ways of making analysis using this indicator.
- The Squeeze:- When the two outer bands (The Upper and The Lower) come close together, like squeezing the Middle Band. What this indicates is the market is calm and not moving much (or the market experiences low volatility). Usually, cryptocurrency traders see this as a sign that big price movies might happen soon.
- The Breakouts:- Most of the time, the price stays within the bands (about 90% of the time). But when it breaks out, going above or below the bands, it is crucial, because this could be the indication of a major price change (that is, the price of the crypto or asset might move up or down significantly.
Notably, Bollinger Bands do not predict the direction of the priced change; they simply initiate that a substantial price movement, whether it is an increase (up) or a decrease (down), could be on the horizon.
Crypto traders often use other tools and analysis techniques to try to determine the likely direction of a price movement. That is why, it is said that this indicator gives the best result, when used in combination with those indicators that can address its limitations.
6. Limitations of Bollinger Bands
Like other indicators of similar character, Bollinger Bands also have a few serious limitations.
- Not Directional:- Bollinger Bands do not tell you if the price will go up or down.
- False Signals:- They can give false signals, leading to bad trades.
- Lagging Indicator:- They rely on past data, so they may not catch rapid price changes.
- Not Standalone:- They work best when combined with other analysis indicators for better accuracy.
- Market Whipsaws:- They can be choppy in sideways markets (relatively stable within a range, without experiencing significant upward or downward trends), making interpretation tricky. They might suggest a potential breakout, when, in reality, the market remains stagnant.
Endnotes
In conclusion, Bollinger Bands are a valuable indicator for beginners in crypto trading. These bands help measure price swings and predict potential price movements. They consist of three lines: a middle line, which is a 20-day moving average, and upper and lower bands, generally determined by adding and subtracting two standard deviations. When the price touches the upper band, it is considered overbought, and when it touches the lower band, it is oversold. However, Bollinger Bands do not predict price direction, and can sometimes give false signals. They work best when combined with other indicators and should be used with caution, especially in sideways markets.