‘The trend is your friend’. We’ve all heard it, and it makes perfectly logical sense; but in practice, this advice is so opaque that it’s practically worthless. Because even if you’re on the ‘right’ side of whatever trend is showing at the moment, the timing and entry into that setup is likely what’s going to determine one’s success or failure on that individual trade. So, it’s not enough to just find the direction of the trend and then ‘hope’ that we’re right; we also have to find support (or resistance for down-trends), we need to be patient and exercise discipline while waiting for the setup to build, and then we have to identify risk levels so that if/when we’re ‘wrong’, we have a line in the sand with which to bail in order to save the rest of our equity. In this article, we’re going to share a five-step process for traders looking to trade into new or ‘fresh’ trends using price action .
Know Your Time Frames
New traders often wonder ‘which time frame is ‘best’’? This is very similar to asking ‘what is the best temperature’. Well, it’s relative. Some like it colder, others like it warmer; but by and large most people are in the same ballpark range of comfort. Chart time frames work like this, as well. If you’re a scalper looking to hold positions no longer than 20 or 30 minutes, the setup on the monthly or weekly chart is probably going to be so divorced from the dynamics that you’re following that you might as well be looking at another market altogether. And if you’re trading a monthly setup, what’s taking place on the one or three minute chart is probably going to be pretty inconsequential to your ‘big picture’ setup.
There is no ‘best’ time frame. Time frames are merely different looks at the same picture; with the shorter or tighter time frames offering a more granular, detailed look at near-term price action. The downside to this greater detail is noise; as those shorter time frames are, in general, considerably noisier than longer-term charts. But the longer-term charts are significantly slower and not nearly as actionable; so the prerogative here should be one of balance.
Multiple time frame analysis is the process of using a variety of chart time frames to plot strategy for a market . This has the benefit of getting the consistency of the longer-term charts along with the granularity and detail of the shorter-term charts. The downside is that an element of subjectivity is introduced as we’re now analyzing two different charts; but provided that the trader can find ‘balance’ between the utilization of these charts, the benefit should far outweigh the additional subjectivity that’s introduced.
| Trader ‘Style’ | ~ Holding Period | Trend Chart | Entry Chart |
|---|---|---|---|
| Long-Term | 1 Week + | Weekly | Daily |
| Swing-Trader | few days – few weeks | Daily | 4 hour |
| Short-Term | few hours – few days | 4 hour | 1 hour |
| Day-Trader/Scalper | < few hours | 1 hour | 15 minute |
Created by James Stanley, originally published in The Time Frames of Trading
Don’t Chase the Breakout
The period that is often most dangerous to trade a new move is also when it happens to be the most attractive, and that’s when prices are breaking out of previous support or resistance. Breakouts can be difficult to trade, even for experienced traders, because by nature it’s the process of something ‘new’ happening and thereby there’s no recent data or observations from which we might be able to derive strategy.
Chasing breakouts, or buying after price has already run through resistance or selling after price has dropped through support, can often lead to challenging trades. Even if you’re right on the direction, you’ll often have to let the position retrace against you before the ‘trend-side’ move continues. So, rather than chasing a new breakout – wait. Let price action run-higher or lower, and chalk away the potential for a trend-side entry in the not-too-distant future.
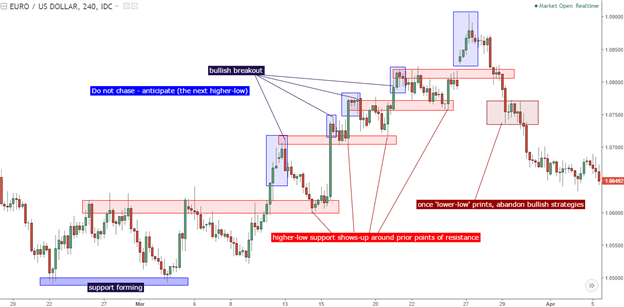
Use the breakout merely as a signal: The fact that buyers were able to power-thru resistance can be a positive indication of further top-side potential. But rarely is a market one-sided; after that new-high comes-in, we’ll often see traders taking profit; and even some trying to fade the move. Combine this with the fact that buyer demand is likely diminished by the fact that prices are now-higher; and we have a recipe for a pullback. This is the exact time that you do not want to be chasing a move higher.
Chart prepared by James Stanley
Wait for Support to Show-Up Around Prior Resistance (for up-trends)
Watching a fresh breakout can be trying for a trader’s patience, and for the new trader that can be a challenging exercise as their only real option whilst watching a breakout take place is to either chase it, or fade it (go short after a bullish breakout). Given that a breakout is, by definition, a ‘new’ observation of higher or lower prices, this is an inopportune time to open positions.
Instead, that prior level of resistance that had previously capped price action can now be re-assigned as potential support. Traders can let the breakout develop, and let the market set a new short-term ‘higher-high’. After that new high is set, traders can then wait for the next ‘higher-low’, and this will often show-up at or around a prior resistance level.
We discussed this concept in the article, A Simple but Effective Price Action Tell , and on the chart below, we can see multiple iterations of this taking place in the recent move in EUR/USD.
Chart prepared by James Stanley
Use the Shorter Time Frame to Confirm Support & Early Stage of Directional Move
Once the breakout has been found, and once the pullback has gotten under-way, traders can begin to plot their trend-side entries. This is where the greater detail and granularity of that shorter-term chart can be helpful from the additional perspective that’s provided.
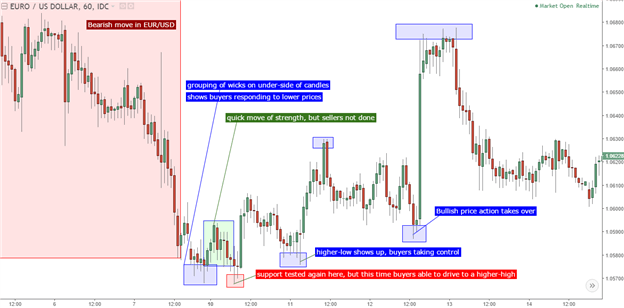
To attempt at timing the entry, the trader can wait for the pullback to begin to slow. So if we’re looking at a bullish move, we’d want to have already seen the breakout produce the higher-high, followed by a pullback bringing price closer to prior resistance; at which point we can look for support to begin to show on the shorter time frame.
If buyers are responding to falling prices, wicks will show-up on the under-side of the shorter-term candles as demand begins to out-strip supply. And as buyers begin to take-over, prices will begin to edge higher on that shorter-term chart as sellers succumb to even greater demand. And it’s as this is taking place that traders want to investigate the top-side entry, because the point of support that was just established, as highlighted by those under-side wicks, is where the trader can look to place their stop. For a more in-depth explanation behind using price action to plot supply and demand, please check out our article, Using Support and Resistance to Trade Supply and Demand .
Chart prepared by James Stanley
Setting Risk and Bailing When Proper
After the trade has been identified, traders are going to want to add a stop as they trigger or shortly after they open the position. That way, if matters reverse, the trader has some element of down-side protection. But key here is one of expectations: Price action is rarely perfect, and perhaps more to the point, price action swings are blatantly obvious and most market makers can visibly see where prices had previously reversed. Most market makers also know these points are often used for stop or limit placement, so these price action swings can be like a red beacon for ‘free liquidity’ for market makers executing on sitting orders.
So, rather than placing the stop at the exact low (for up-trends), look to ‘nest’ the stop a bit-lower so that your exit isn’t at a blatantly obvious point in the market. If there’s any element of support or resistance confluent nearby, incorporate that as well.
So, for instance, if USD/JPY just put in a swing-low at 112.03, you probably don’t want your stop right at 112.03; but rather below the ‘psychological level’ of 112.00. So, giving the entry an extra 10 pips of ‘wiggle room’ can afford you a bit of distance should that prior swing, or the psychological level at 112.00 face a retest.
If the stop does look like it would be hit, traders should avoid giving it even more room in the hope that they can stay in the trade. This is considered ‘throwing good money after bad’ because, at that point, your idea is almost proven incorrect and, given that you’re already in the trade and somewhat invested, it can be difficult to temper one’s own bias whilst in a trade that’s already eating your equity.
One ‘bad’ trade can wipe away the gains from numerous winners, and throwing good money after bad is one of the common ways that trader’s sink into this pitfall. So, set your risk at the outset of the trade, and place stops at a level that you’ll be able to walk away from the trade without any remorse. And if the stop gets hit, simply look for a new trend elsewhere.
— Written by James Stanley, Senior Strategist for DailyFX.com
Contact and follow James on Twitter: @JStanleyFX


