
Nature can teach us many things. Did you know that there is a crypto trading indicator that operates based on a mysterious calculation inspired by nature? Yes, we are talking about Fibonacci Retracement Levels. This tool is considered a remarkable asset in the world of crypto trading. While some have questioned the reasoning behind using this calculation to make trading decisions, the tool remains popular among traders due to the impressive results it offers. Definitely, it is worth taking a few minutes to learn about this exceptional tool. Let’s start!
1. Fibonacci Retracement Levels: What You Should Know
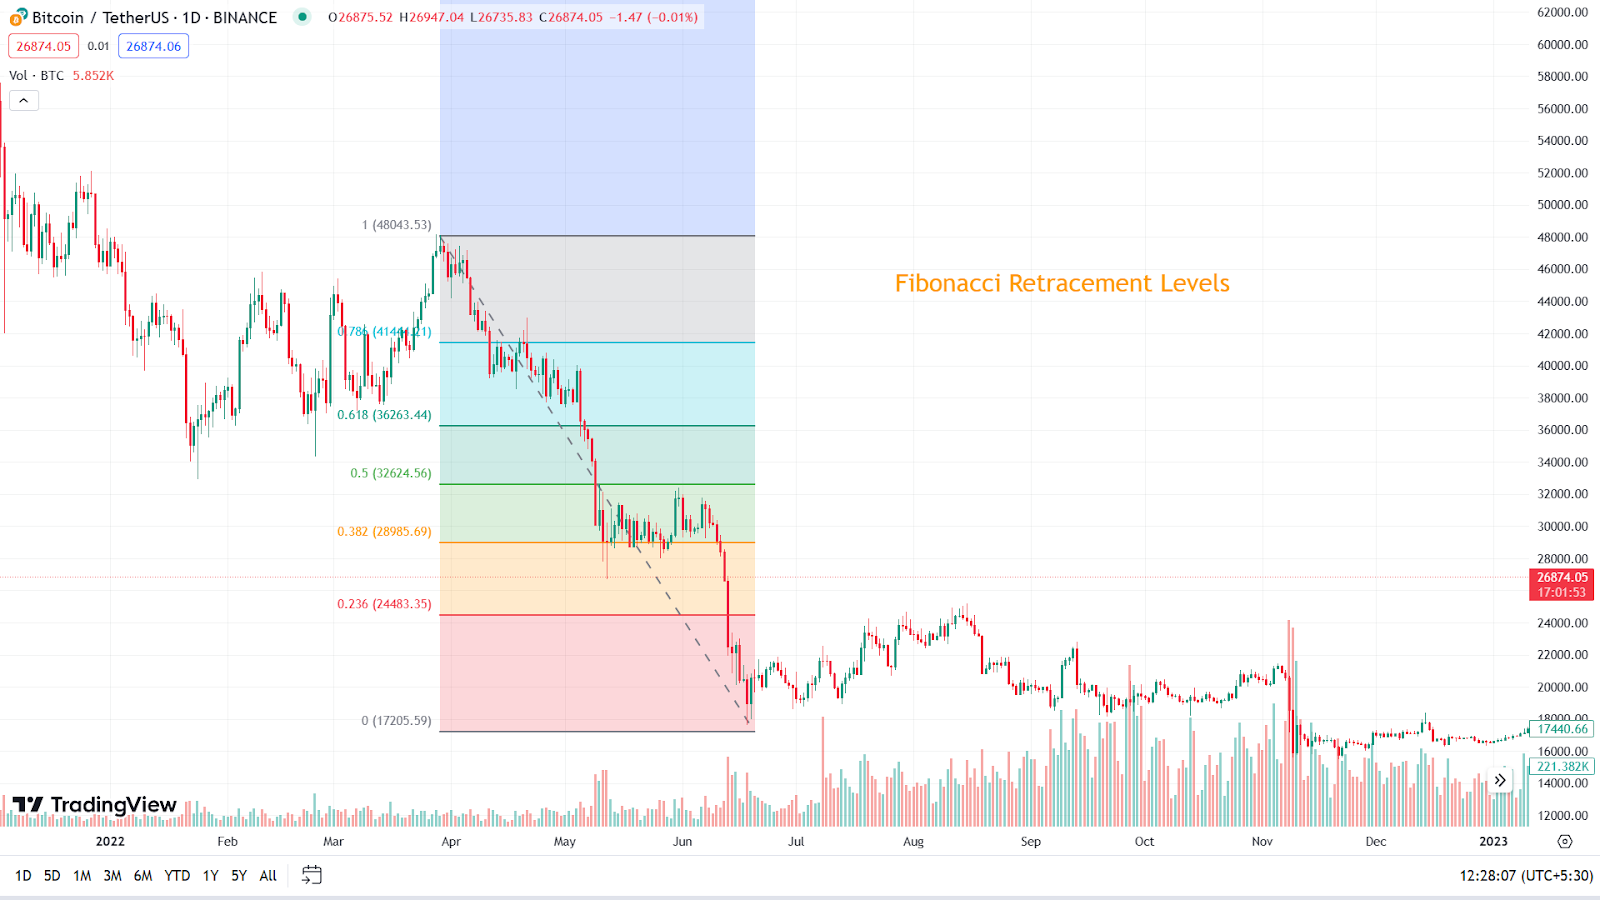
Fibonacci Retracement is an extremely popular crypto trading indicator. It is based on the Fibonacci number sequence introduced by Leonardo Pisano, popularly known as Fibonacci. To gain a better understanding of this tool, it is essential to grasp the concept of the Fibonacci Sequence and Fibonacci Ratios.
1.1. What’s Fibonacci Sequence
The following is the Fibonacci sequence:
| 0, 1, 1, 2, 3, 5, 8, 13, 21, 34, 55, 89 etc. |
In this sequence, you can observe that each number is the sum of the two preceding ones. Interestingly, this sequence is prevalent in nature, appearing in various forms such as spiral shapes in seashells, flower petals and star constellations, and more. It is thought that Fibonacci developed this sequence while observing nature. Some believe that this sequence can even shed light on human behaviour. Actually, this is the logic that the fans of this tool use to justify the relevance of the indicator in the crypto trading sector. What the indicator does is bring the potential of this sequence into the trading world to help understand price fluctuations.
1.2. Fibonacci Ratios: How To Calculate Fibonacci Retracement Levels
Fibonacci ratios play a key role in understanding Fibonacci Retracement Levels. These ratios help us identify potential support and resistance levels in a price trend.
Here is how you can calculate them:
- 68.1% Ratio:- To find this ratio, divide a Fibonacci number by the one that follows it.
Eg. 21/34 = 0.681
- 38.2% Ratio:- To calculate this ratio, divide a Fibonacci number by the one located two places to the right.
Eg. 21/55 = 0.382
- 23.6% Ratio:- This ratio is found by dividing a Fibonacci number by the one situated three places to the right.
Eg. 21/89 = 0.236
2. Steps to Launch Fibonacci Retracement Levels Indicator in TradingView
Launching Fibonacci Retracement Levels in a chart is a simple five-step process.
- Step 1: Sign In to TradingView
Log in to your TradingView account or create one if needed.
Select a random chart to apply the indicator to.
- Step 3: Select Fibonacci Retracement Levels
Click on the ‘Fib Retracement’ icon in the left corner bar.
- Step 4: Check Ration Settings
Ensure the levels in the settings match the Fibonacci ratios you need.
- Step 5: Find Market Momentum
Identify two extremes in the market to place the indicator for analysis.
3. How to Use Fibonacci Retracement Levels to Read A Chart
The fundamental concept, over which Fibonacci Retracement Levels stands, is when there is a strong momentum in the crypto market in one direction, it often pauses briefly before continuing.
Traders select swing high and swing low points on a chart. Then, they apply the ratios of 68.1%, 38.2%, and 23.6%, which create horizontal lines between these points. Additionally, traders often add two more levels, 50% and 76.4%, though not part of the Fibonacci sequence.
Basically, these five lines offer potential areas where cryptocurrency prices may reverse within a trend or encounter support and resistance.
3.1. What Is Golden Ratio in Fibonacci Retracement Levels
The ratio of 61.8%, in Fibonacci Retracement Levels, is considered as the Golden Ratio. It stands out as it is considered a strong indicator of potential price reversals. Its special significance lies in its frequent alignment with market turning points, making it a vital level for traders to monitor in predicting changes in asset prices.
4. Four Points Why One Should Not Rely on Fibonacci Retracement Levels
It is important to keep one thing in mind that no crypto trading indicator can promise one hundred per cent accuracy. The Fibonacci Retracement Levels indicator too has some serious limitations.
- Subjectivity:- The tool depends on chosen points, leading to interpretation variations.
- Market Volatility:- Levels may not always work in volatile markets.
- Multiple Indicators:- Sole reliance on Fibonacci overlooks other essential market indicators.
- Historical Data:- Past performance is no guarantee of future success; market behaviour evolves.
Endnote
Fibonacci Retracement Levels, rooted in the Fibonacci sequence, are a widely-used tool in crypto trading. These levels help traders identify potential price reversal points by applying key ratios, offering insight into market momentum. However, it is essential to remember their limitations, such as subjectivity and vulnerability to market volatility. While not a guarantee of success, understanding and using Fibonacci Retracement Levels can be a valuable addition to a trader’s toolkit, aiding in the analysis of cryptocurrency trends.