Close Menu
CryptoHoppers.comCryptoHoppers.com
    What's Hot

    Russia’s industrial powerhouse Rostec to launch ruble-backed token on Tron

    July 5, 2025

    Pi Network’s Collaboration with BNP Paribas: Will PI Test $1?

    May 4, 2025

    Bitcoin drops below 0.95 cost basis quantile, signaling potential risk: Glassnode

    September 24, 2025
    Facebook X (Twitter) Instagram
    • Privacy Policy
    • Get In Touch
    Facebook X (Twitter) Instagram
    CryptoHoppers.comCryptoHoppers.com
    • News

      Strategy moves 43,415 Bitcoin, Arkham reveals the real reason behind the mega transfers

      November 15, 2025

      Bitcoin Tracks Nasdaq Losses, Not Its Rallies

      November 14, 2025

      XRP Price Jumps as First U.S. Spot ETF Debuts on Nasdaq, Analysts Predict Rally in Weeks

      November 13, 2025

      Cardano and Wirex Launch Global “Cardano Card” for 6 Million Users, Spend 685+ Cryptos

      November 12, 2025

      From $10K to $500K: DeFi Meets Reality

      November 11, 2025
    • Technology

      Pantera Launches DAT Dashboard to Track Crypto Asset Tokens

      November 17, 2025

      Arthur Hayes moves $2.5M in ETH and tokens to market makers: Is he buying ZEC?

      November 16, 2025

      Dragonfly Executive Calls Current Crypto Market Dip “Easiest Bear Market Ever”: Here’s Why

      November 15, 2025

      Why this “Omnibank” might outperform cryptos like Solana and Ripple

      November 14, 2025

      Chainlink (LINK) Set for Major Move as Binance Sees $26M Outflow

      November 13, 2025
    • Learn/Guide

      Figment and OpenTrade launch new stablecoin yield product

      November 17, 2025

      Bitcoin profit declines amid stabilization of altcoin profits: Glassnode

      November 16, 2025

      Cardano founder Charles Hoskinson and Scaramucci’s firm invest in Trump-linked American Bitcoin in a $220M round

      November 15, 2025

      Bitwise’s spot XRP ETF may become the next launch as SEC moves to speed filings

      November 14, 2025

      Bitcoin drops under $100K, triggering $117M in long liquidations in one hour

      November 13, 2025
    • NFTs

      The Unraveling and Rebirth of Digital Ownership: A Post-Mortem on the 2021 NFT Empire and the Rise of Verifiable Utility | NFT CULTURE | NFT News | Web3 Culture

      November 5, 2025

      Triple Trouble: Shepard Fairey, Damien Hirst, and Invader Join Forces for Monumental Exhibition at Newport Street Gallery | NFT CULTURE | NFT News | Web3 Culture

      October 2, 2025

      Slimesunday’s Magnum Opus: ‘Banned from New York’ Blows the Lid Off Digital Censorship | NFT CULTURE | NFT News | Web3 Culture

      July 22, 2025

      1mouth Analog: miirror’s Raw Leap from Digital to Handmade Chaos | NFT CULTURE | NFT News | Web3 Culture

      May 9, 2025

      NFTCulture Expands Into TCGs with Cardcore.xyz: Where Digital Collectibles Meet Competitive Play | NFT CULTURE | NFT News | Web3 Culture

      May 8, 2025
    • Regulation

      Selig to Face Senate Hearing for CFTC Chair After Trump’s Pick Pulled

      November 17, 2025

      After CFTC Fine, Polymarket Reopens U.S. Prediction Market in Beta

      November 16, 2025

      U.S. Treasury Sanctions 27 in Mexico Gambling Network Linked to Cartels

      November 15, 2025

      UK Must Develop Pound Stablecoins to Stay Competitive in Finance

      November 14, 2025

      Aave Labs Secures License for Zero-Fee Stablecoin Ramp Across Europe

      November 13, 2025
    • Business

      SBI Digital Markets Partners With Chainlink to Launch Cross-Chain Asset Hub

      November 8, 2025

      UNDP Prepares Global Blockchain Training Initiative for Sustainable Growth

      November 7, 2025

      Cipher Mining Raises $1.4 Billion to Complete Texas Data Center Project

      November 6, 2025

      Strategy Inc. Swings Back to $2.8B Q3 Profit as Bitcoin Gains Reignite Balance Sheet

      October 31, 2025

      SharpLink Moves $200M in Ethereum to Linea in Treasury Power Play

      October 28, 2025
    • Live Pricing
    CryptoHoppers.comCryptoHoppers.com
    Home » Enhancing Your Crypto Trading Knowledge with A/D Line Indicator
    Learn/Guide

    Enhancing Your Crypto Trading Knowledge with A/D Line Indicator

    November 29, 20234 Mins Read
    Facebook Twitter Pinterest LinkedIn Tumblr Email
    What is Accumulation _ Distribution Line
    Share
    Facebook Twitter LinkedIn Pinterest Email


    If you are a crypto trader who relies on price action to make trading decisions, then you must learn about a simple indicator that uses volume and price as parameters to provide quality trading signals. This indicator is quite different from other indicators that use price and volume. By now, you may have realised what is being talked about. Yes, it is about the Accumulation/Distribution Line Indicator. It is time to delve deeper into this indicator. Let’s start!

    1. What’s Accumulation/Distribution Line 

    The Accumulation/Distribution Indicator helps us figure out whether an asset’s price is likely to go up or down in the future. It does this by looking at the relationship between the asset’s closing price and how much of it is being bought (accumulation) or sold (distribution). 

    1.1. The History of Accumulation/Distribution Indicator 

    The Accumulation/Distribution Indicator, often called the A/D indicator, was developed by Marc Chaikin. He created it to help traders assess the supply and demand of a financial asset. 

    2. How Does Accumulation/Distribution Indicator Works 

    The Accumulation/Distribution Indicator helps traders predict when the price of an asset might change direction. It does this by showing the relationship between the asset’s price and how many people are buying or selling it. 

    3. Calculating Accumulation/Distribution Indicator: The Easy Method

    The Formula for Accumulation/Distribution is:

    A/D = Previous A/D + Money Flow Volume (Current)

    Here is how it works:

    First, you calculate a number called the Money Flow Multiplier, which tells you how strong the buying or selling pressure is.

    Money Flow Multiplier = (Closing Price – Low Price of the Period) – (High Price of the Period – Closing Price) / (High Price of the Period – Low Price of the Period)

    Next, you find the Money Flow Volume for the current period. It is the product of the Money Flow Multiplier and the volume of that period.

    Money Flow Volume = Money Flow Multiplier * Period Volume 
    • Accumulation/Distribution (A/D) Value 

    To get the A/D value, you add the Money Flow Volume for the current period to the previous A/D value. This shows you whether money is accumulating (going in) or distributing (going out) in the asset.

    A/D = Previous A/D + Money Flow Volume (Current) 

    You repeat this process for each period, continuously adding or subtracting the new Money Flow Volume to calculate the A/D value. 

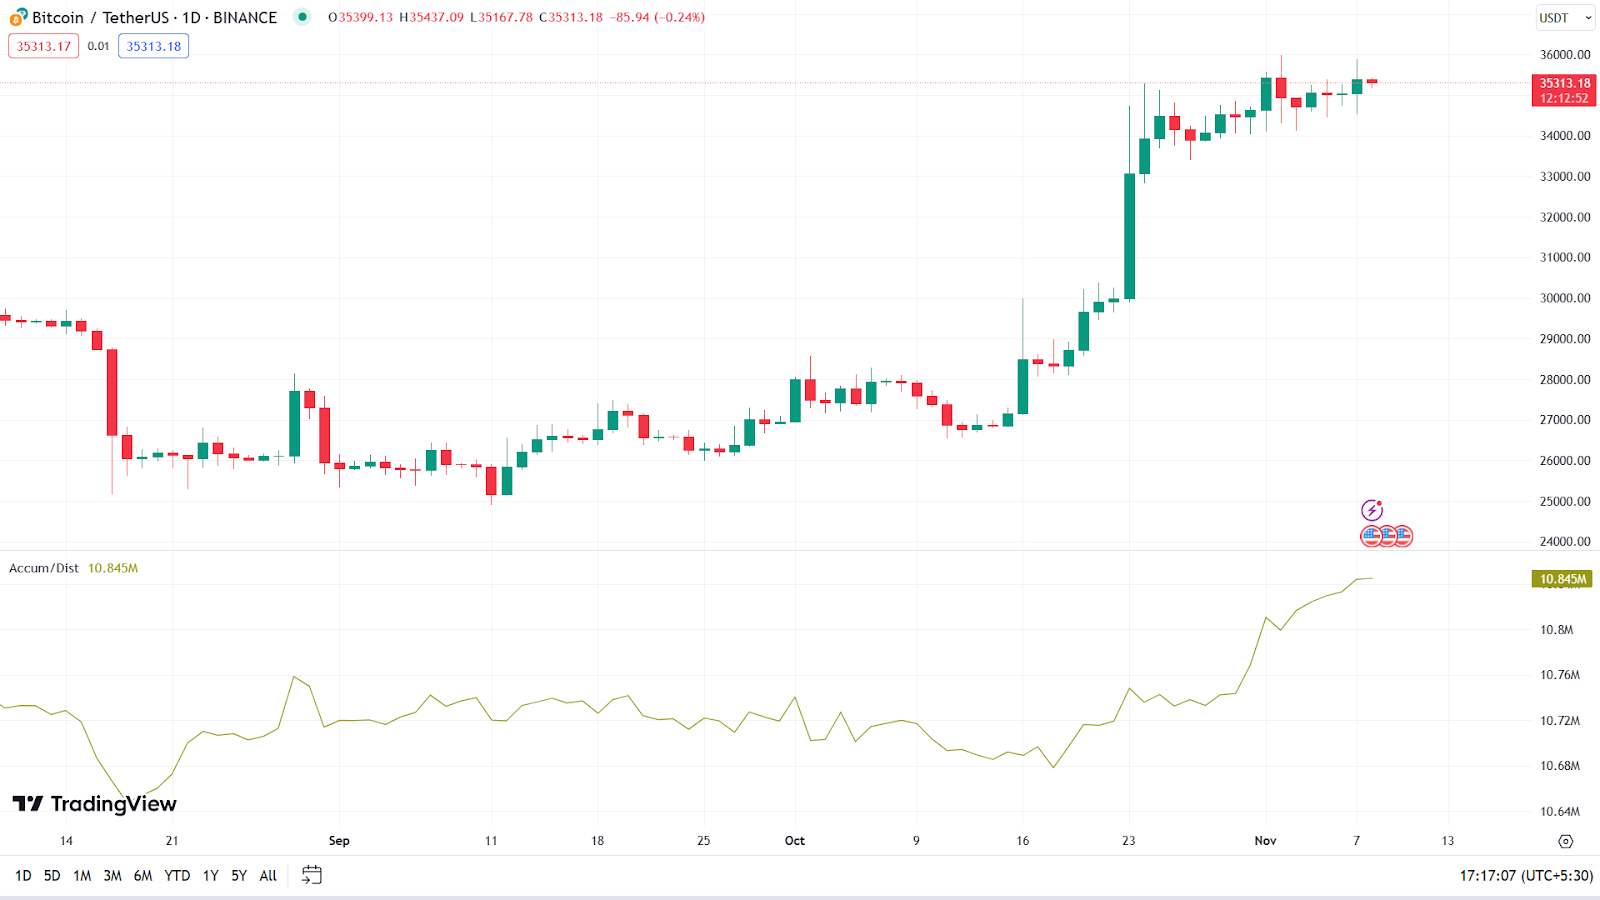
    4. Easy Guide to Launch Accumulation/Distribution Indicator on a TradingView Chart

    Here is a step-by-step guide to launching the Accumulation/Distribution Indicator on a TradingView chart:

    • Log in to your TradingView account 
    • Choose the chart for the asset you want to analyse 
    • Look for the ‘Indicators’ button, usually at the top of the chart, and click on it
    • In the search bar, type ‘Accumulation/Distribution Indicator in the search results, click on it to add it to your chart 
    • You can customise the indicator by adjusting its settings 
    • Click ‘OK’ 
    • The A/D line will now appear on your chart 
    • Analyse the Accumulation/Distribution Line

    5. Ways to Analyse Accumulation/Distribution Line 

    The prime ways to analyse the A/D line are given below:

    When the A/D Line goes up, it means more money is coming into the asset. This can be a sign of potential price increases.

    When the A/D Line goes down, it suggests more money is leaving the asset. This could indicate potential price decreases. 

    Look for differences between the A/D Line and the price of the asset. If they move in opposite directions, it might signal a trend change.

    Use the A/D Line to confirm the strength of a price trend. If the A/D Line aligns with the price movement, it can provide more confidence in the trend’s direction. 

    Endnote 

    The Accumulation/Distribution Indicator developed by Marc Chaikin, is a valuable tool for traders to assess the supply and demand of financial assets. It helps predict potential price movements by analysing the interplay between buying and selling pressures. Using its formula, traders can calculate the A/D value. Launching it on a TradingView chart is made easy with a step-by-step guide. Interpreting the A/D Line offers insights into potential price changes, making it a useful resource in the world of trading. 


    Source link

    Share. Facebook Twitter Pinterest LinkedIn Tumblr Email

    Related Posts

    Figment and OpenTrade launch new stablecoin yield product

    November 17, 2025

    Bitcoin profit declines amid stabilization of altcoin profits: Glassnode

    November 16, 2025

    Cardano founder Charles Hoskinson and Scaramucci’s firm invest in Trump-linked American Bitcoin in a $220M round

    November 15, 2025

    Bitwise’s spot XRP ETF may become the next launch as SEC moves to speed filings

    November 14, 2025
    Top Posts

    US Institutions Take $206,000,000 out of Crypto Investment Products Amid Interest Rate Worries: CoinShares

    April 23, 2024

    Ethereum Classic [ETC] leads the altcoin decline- Here’s the detailed report

    May 18, 2023

    CFTC charges digital asset platform over ‘pig butchering’ scheme

    January 20, 2024

    Welcome to CryptoHoppers.com! Stay informed with the latest updates, trends, and insights from the dynamic world of cryptocurrencies. From Bitcoin to altcoins, blockchain technology to decentralized finance (DeFi), we cover it all. Discover expert analysis, market trends, regulatory developments, and exciting innovations shaping the crypto industry.

    Top Insights

    Strategy moves 43,415 Bitcoin, Arkham reveals the real reason behind the mega transfers

    November 15, 2025

    Bitcoin Tracks Nasdaq Losses, Not Its Rallies

    November 14, 2025

    XRP Price Jumps as First U.S. Spot ETF Debuts on Nasdaq, Analysts Predict Rally in Weeks

    November 13, 2025
    Advertisement
    Demo
    CryptoHoppers.com
    Facebook X (Twitter) Instagram
    • News
    • Technology
    • Learn/Guide
    • Regulation
    • NFTs
    • Business
    • Live Pricing
    © 2025. Designed by CryptoHoppers.com.

    Type above and press Enter to search. Press Esc to cancel.