
Seasoned cryptocurrency traders recognise the pivotal role played by support and resistance in the intricate realm of price action trading. Mastery of these concepts is a hallmark of successful traders.
Support and resistance, while seemingly elementary, unveils a multifaceted landscape upon closer examination. Delving into this concept reveals its nuanced layers, akin to peeling back the intricate layers of an onion. In our exploration, we embark on a comprehensive journey to unravel every facet associated with support and resistance, with a keen focus on their application within the domain of price action trading. The forthcoming discourse aims to equip crypto traders with a profound understanding of these dynamics, offering insights essential for navigating the complexities of the cryptocurrency markets.
Are you prepared for the enlightening exploration that lies ahead?
1. Support & Resistance Defined
In crypto trading, Support and Resistance are like vital checkpoints indicating where market shifts are likely. Picture them as key levels where traders foresee potential changes in the crypto’s direction.
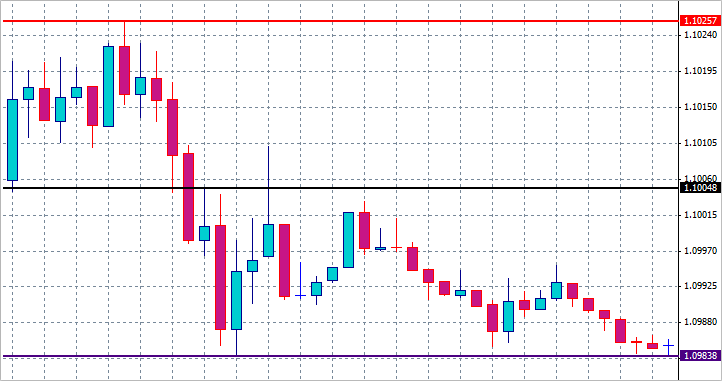
Support acts as a safety net, preventing prices from dropping too low, while Resistance serves as a barrier, restricting prices from climbing too high.
These levels provide crypto traders with valuable trade signals, akin to signposts.
2. Support & Resistance in Price Action Trading
Price Action Support and Resistance are key concepts in crypto trading. Support is like a price floor where demand is strong, preventing the price from falling further. It is where buyers tend to step in. Resistance, on the other hand, acts like a ceiling where selling interest kicks in, preventing the price from rising. Together, they create trading ranges. Traders use these levels to make decisions – generally, buying near support and selling near resistance. Recognising these levels helps anticipate price movements, offering entry and exit points.
3. Prime Methods of Drawing Support & Resistance
Mainly there are six methods to draw support & resistance:
- Psychological Support & Resistance
At the forefront of effective support and resistance methods is understanding market psychology. Identifying round numbers and tracking 52-week highs and lows is crucial. These levels reflect crypto traders’ behavioural patterns, as round numbers often act as psychological barriers, and 52-week extremes signify key milestones. Recognising these psychological cues enhances technical analysis by integrating human emotions into market dynamics, providing valuable insights into potential price reversals and breakthroughs.
- Price Action Formations
Price Action Formations prioritise simplicity in identifying support and resistance. Cryptocurrency traders analyse natural price movements, focusing on formations like price gaps, congestion zones, and measured moves. Price gaps signify abrupt shifts, congestion zones indicate areas of price indecision, and measured moves offer predictive insights. This method emphasises intuitive observation, enabling traders to make informed decisions based on observable patterns, enhancing the reliability of support and resistance zones.
- Market Structure Projection
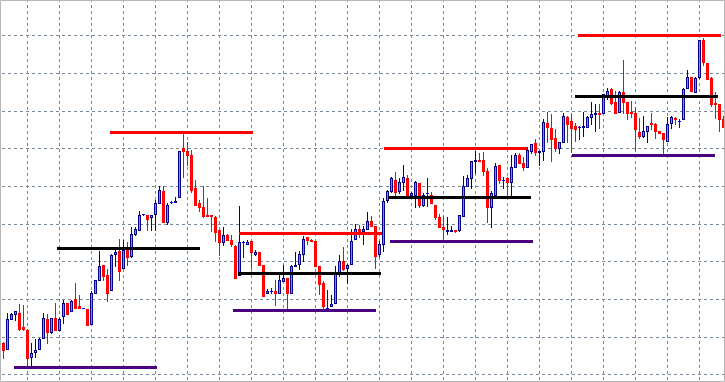
Market Structure Projection relies on recognising swing pivots in the form of peaks and troughs on a price chart. These turning points, or swing pivots, constitute the market structure’s foundation. Crypto traders project support and resistance by connecting and extending lines from these pivotal points. This method, involving horizontal levels and trendlines, offers a comprehensive understanding of the market’s inherent structure, aiding in predicting potential price movements based on historical turning points.
Volume Formations incorporate market interest, with extreme or concentrated volume acting as reliable signals for support and resistance levels. Climactic volume on candlestick or range bar charts, Market Profile analysis, Price by Volume, and Volume Weighted Average Price are employed. Integrating volume data provides deeper insights into significant market levels, allowing crypto traders to measure the strength of buying or selling interest. This method enhances analysis by adding a quantitative dimension, offering a holistic view of support and resistance dynamics.
Computed Levels involve using indicators overlaying price action to identify support and resistance. This method includes Moving Averages, volatility bands like Bollinger and Keltner, and calculated pivots such as Floor Traders, Camarilla, and Woodies. Indicators offer additional layers of analysis, confirming potential support and resistance zones through diverse technical tools. By leveraging these computed levels, crypto traders gain a comprehensive understanding of market dynamics.
- Projected With Computation
Projected With Computation combines market structure analysis with simple calculations. Techniques include Fibonacci retracements/extensions, Andrew’s Pitchfork using a 50% ration, and Speedlines based on simple fractions. By adding a computational element to price anchors, these methods enhance precision in determining potential support and resistance zones. This approach, grounded in both market structure and mathematical analysis, provides cryptocurrency traders with more nuanced insights into market behaviour, allowing an accurate assessment of potential price movements.
4. Analysing The Strength of A Strong Support/Resistance Level: Simple Methods
Figuring out if a chart is likely to show powerful support or resistance levels is crucial for building a strong strategy in crypto trading. There are various ways to analyse this, and here are some simple methods that crypto traders can use.
Confluence analysis involves seeking confirmation from multiple sources, such as intersecting trend lines or coinciding support/resistance zones across different timeframes.
Imagine the convergence of a bearish trend line and a horizontal resistance level. This overlapping support reinforces the likelihood of resistance, as both elements independently suggest potential price barriers.
Testing frequency assesses how often the market interacts with a specific support or resistance level. Frequent tests contribute to the establishment of a strong support or resistance zone, indicating a higher likelihood for market participants recognising and reacting to that level.
However, caution is necessary, as excessive testing weakens the support or resistance. With each trial, eager buyers or sellers may diminish, leading to a potential breakdown when the level is finally tested once too many times.
Price action signals play a vital role in understanding the strength of a support or resistance level. When the market touches a support or resistance zone, close scrutiny of the price action is essential. A healthy support zone typically generates a strong bullish reaction during tests. Look for candlestick patterns like Pin Bars, characterised by long lower shadows, signalling increased buying pressure.
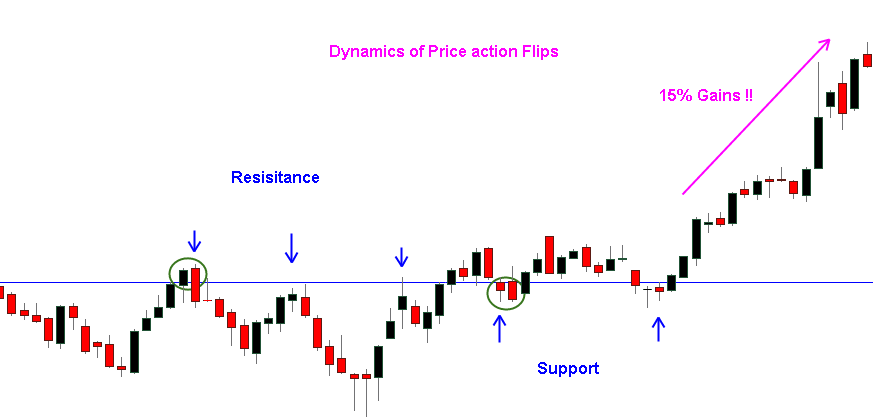
- Support or Resistance Flipping
Support or resistance flipping refers to the transformation of a failed support into a resistance, or vice versa. When a support level fails, it can turn into a significant resistance zone. Conversely, a broken resistance may act as a robust support in the future.
Decisive breaks involve identifying price action patterns that indicate the potential ineffectiveness of a support or resistance level. This could include a close beyond the support or resistance, breaching swing lows or highs, or surpassing a specific volatility threshold.
The significance of support or resistance varies with the timeframe from which they are identified. Longer-term support or resistance zones, identified from larger timeframes, tend to carry more weight and influence. This concept is foundational for multiple-timeframe trading strategies, where aligning key levels across various timeframes provides a more comprehensive view of potential price barriers.
- Relevance to Trading Horizon
Evaluating the relevance of a support or resistance level to your specific trading horizon is crucial. A support zone identified on a weekly chart may hold less significance for an intraday trader analysing a 3-minute chart. To keep charts uncluttered and analysis focused, it is essential to consider the proximity in both time and price of identified support or resistant levels to the current market conditions.
5. How to Trade a Support or Resistance: Explained
The simplest strategy is when prices approach support, consider buying for potential upward movement and conversely, near resistance, consider selling for a potential downturn. Confirm signals with price action patterns such as candlesticks, to validate trade decisions. Employ stop-loss orders to mitigate risk, ensuring disciplined risk management.
Where the limited scope of the basic strategy ends, the advanced ones begin. Here are a few advanced strategies to trade a support or resistance:
- Using Reliable Support/Resistance for Profit-Taking
When looking to secure profits, rely on established support and resistance levels. These levels act as strategic points to assess potential market reversals on significant price movements. Crypto traders often use these well-defined zones as areas to close positions and capture gains. Particularly useful in uncharted market territory, predictive techniques such as Fibonacci Extensions offer additional tools for profit-taking decisions.
- Price Movement Confirmation and Risk Control
To confirm potential price movements and control risk, analyse price patterns at support or resistance levels. These patterns provide visual cues, indicating market sentiment and potential reversals. Additionally, they serve as pattern stops, offering predefined points to exit trades and manage risk effectively.
- Optimal Entry with Limit Order
For confident entries, use limit orders to secure an optimal price. By placing a limit order, traders specify the maximum price they are willing to pay (for a buy) or receive (for a sell). This allows for precision in execution, ensuring entry at desired levels when confident in the support or resistance holding.
Fine-tune entry points and improve the reward-to-risk ratio by anticipating support or resistance to hold and fading false breakouts. This strategy involves entering a trade against the prevailing breakout trend, aiming to profit from a potential reversal. Fading false breakouts requires careful monitoring of price action at support or resistance levels to identify opportunities for contrarian positions.
- Breakout Pullbacks for Anticipated Failures
When expecting support or resistance to fail, consider breakout pullbacks as a more prudent entry strategy. Instead of entering trades directly on breakouts, wait for a retracement or pullback to enter the market. This approach allows for increased confirmation of the anticipated failure, potentially reducing false signals and improving overall trade accuracy.
- Leveraging Repeated Failures
Extend trend analysis by capitalising on repeated failures of support or resistance levels. Recognise that repeated support failures suggest a bear trend, indicating weakening buying interest. Conversely, repeated resistance failures imply a bull trend, signalling increased buying pressure.
Endnote
In conclusion, mastering the interplay between price action and support or resistance zones is pivotal for successful cryptocurrency trading. These fundamental checkpoints act as guides, signalling potential market shifts. Understanding methods like psychological cues, price formations, and volume analysis enhances traders’ ability to navigate this intricate landscape. Analysing the strength of these levels involves confluence, testing frequency, and price action signals. Trading strategies range from basic buy/sell decisions near support/resistance to advanced tactics like fading false breakouts and leveraging repeated failures. By combining price action with support or resistance, crypto traders gain a nuanced approach, crucial for informed decision-making in the dynamic realm of cryptocurrency markets.
Disclaimer and Risk Warning
The information provided in this content by Coinpedia Academy is for general knowledge and educational purpose only. It is not financial, professional or legal advice, and does not endorse any specific product or service. The organization is not responsible for any losses you may experience. And, Creators own the copyright for images and videos used. If you find any of the contents published inappropriate, please feel free to inform us.