
This Blockchain Monthly Report for May 2024 provides a comprehensive analysis of the top layer 1 and layer 2 blockchains and offers you a clear understanding of the entire blockchain market. We perform a general analysis and an in-depth analysis, in which we analyse the selected blockchains’ economic activity, user interest, development, scalability, latency, cost, and market performance. We ensure accurate data and insightful analysis using trusted sources and advanced methodologies.
1. Blockchain General Analysis
In the blockchain general analysis section, we evaluate blockchains using Total Value Locked (TVL) and Dominance indexes to identify the top five blockchains this month. To make the analysis clearer, we examine layer 1 and layer 2 chains separately. Additionally, we use the 30-day Change index to understand how the top five chains in both the layer 1 and layer 2 categories have changed over the last 30 days.
1.1. Top Five Layer 1 Chains by TVL and Dominance
Ethereum, BNB Smart Chain, Solana, Bitcoin, and Avalanche are the top five blockchains in the layer 1 blockchain segment on the basis of dominance and TVL.
| Layer 1 Blockchains | Dominance | TVL |
| Ethereum | 81.13% | $67,117,291,559 |
| BNB Smart Chain | 6.81% | $5,636,030,854 |
| Solana | 5.83% | $4,820,977,767 |
| Bitcoin | 1.42% | $1,175,529,567 |
| Avalanche | 1.22% | $1,007,843,019 |
Among the top five layer 1 chains, Ethereum dominates with 81.13% dominance. BNB Smart Chain and Solana follow with 6.81% and 5.83%. Bitcoin shows 1.42% dominance, and Avalanche displays 1.22% dominance.
1.1.1. Top Layer 1 Chains: 30-Day Change
| Layer 1 Blockchains | 30-day Change |
| Ethereum | +23.3% |
| BNB Smart Chain | +5.2% |
| Solana | +28.1% |
| Bitcoin | -2.6% |
| Avalanche | +7.8% |
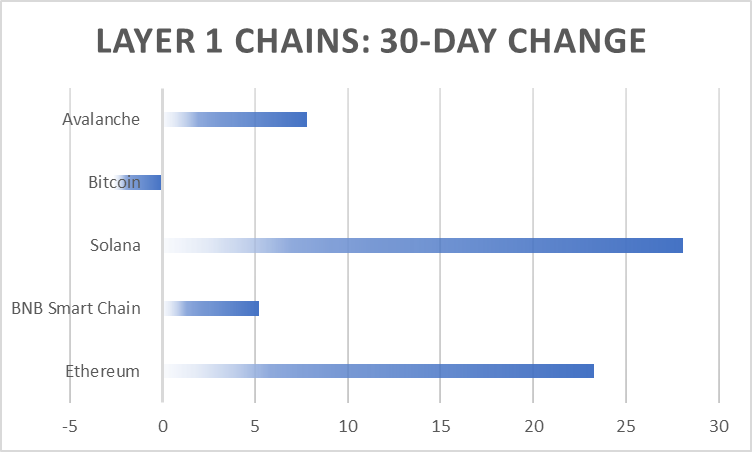
Among these blockchain, only Bitcoin shows a negative 30-day change; it displays a change of -2.6%. Solana marks the highest 30-day change of +28.1%. Ethereum closely follows with +23.3% change. Avalanche and BNB Smart Chain showcases minimal positive changes of +7.8% and +5.2%, respectively.
1.2. Top Five Layer 2 Chains by TVL and Dominance
Arbitrum One, Blast, Base, Polygon POS and Optimism are the top five blockchains in the layer 2 segment, based on TVL and Dominance.
| Layer 2 Blockchains | Dominance | TVL |
| Arbitrum One | 29.50% | $3,148,514,895 |
| Blast | 18.52% | $1,976,079,698 |
| Base | 16.66% | $1,778,022,834 |
| Polygon POS | 9.28% | $990,739,279 |
| Optimism | 8.42% | $898,103,584 |
Among the top five layer 2 chains, Arbitrum One leads with 29.50% dominance. Blast and Base closely follow with 18.52% and 16.66%, respectively. Polygon POS and Optimism exhibit 9.28% and 8.42%, respectively.
1.2.1. Top Layer 2 Chains: 30-Day Change
| Layer 2 Blockchains | 30-days Change |
| Arbitrum One | +18.9% |
| Blast | +37.5% |
| Base | +12.4% |
| Polygon POS | +8.4% |
| Optimism | +2.0% |
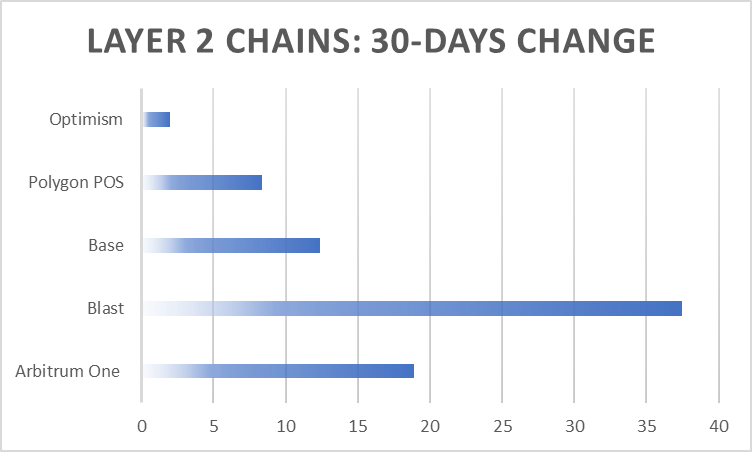
All the chains in the top five layer 2 chains list show positive 30-day changes. Blast registers the highest positive 30-day change of +37.5%. Arbitrum One and Base follow with +18.9% and +12.4%. Polygon POS depicts a change of +8.4%. Optimism presents a minimal change of +2.0%.
2. Best Blockchains This Month By 30-Day Change
In this section, we focus only on the 30-day change indicator, without considering the TVL and Dominance indicators. Importantly, we do not separate layer 1 and layer 2 chains; instead, we consider all chains together. Our goal is to identify the best Performing blockchains based solely on their 30-day change.
| Blockchains | 30-day Change | TVL |
| Core | +285.4% | $23,999,916 |
| Linea | +125.6% | $579,474,178 |
| Scroll | +63.9% | $120,705,581 |
| StarkNet | +46.0% | $309,199,498 |
| Blast | +37.5% | $1,973,664,714 |
| Polygon zkEVM | +28.1% | $13,137,952 |
| Solana | +28.1% | $4,807,347,354 |
| Sui | +26.3% | $738,154,425 |
| Ethereum | +23.3% | $66,927,529,978 |
| Arbitrum One | +18.9% | $3,144,667,067 |
Core registers the highest 30-day change of +285.4%. Linea follows with +125.6%. Scroll, StarkNet, and Blast record +63.9%, +46.0% and +37.5% change, respectively. Polygon zkEVM, Solana, and Sui also register +28.1%, +28.1% and +26.3% change, respectively.
Notably, Ethereum, the top layer 1 chain by dominance and TVL, is in the ninth position, with +23.3% change, and Arbitrum One, the top layer 2 chain by dominance and TVL, is in the tenth position, with +18.9% change.
Among the top five layer 1 chains, only Ethereum and Solana find places in this list, and among the top five layer 2 chains, Arbitrum One and Blast have positions in the list.
3. Blockchains In-Depth Analysis
In this section, we conduct an in-depth analysis of the top five blockchains. We examine various aspects, including economic activity, user interest, development and innovation, scalability, latency, cost, and market performance. To provide more clarity, we analyse the top five-layer 1 and layer 2 chains separately.
3.1. Blockchain Economic Activity Analysis
To perform the economic activity analysis, we mainly use four indices: revenue, fees, volume, and TVL. The revenue indicator shows the total blockchain earnings. The fee indicator reflects the cost users pay for transactions. The volume indicator, the second important indicator to analyse blockchain economic activity, represents the total amount of transactions. The TVL indicator, which is the primary indicator for analysing economic activity in blockchains, measures the total capital staked or locked in the blockchain.
3.1.1. Top Layer 1 Chain Economic Activity Analysis
| Layer 1 Blockchains | Revenue | Fees | Volume | TVL |
| Ethereum | $6.27M | $8.06M | $2.215B | $66.798B |
| BNB Smart Chain | $39.67K | $398.21K | $545.23M | $5.589B |
| Solana | $935.09K | $1.87M | $1.129B | $4.756B |
| Bitcoin | N/A | $1.56M | $237.88K | $1.167B |
| Avalanche | $24.36K | $24.36K | $45.99M | $995.59M |
Among the top five-layer 1 chains by TVL, Ethereum, which has the highest TVL of $66.798B, records the highest revenue of $6.27M. Solana, showing the third highest TVL of $4.756B after BNB Smart Chain’s $5.589B, follows with $935.09K. BNB Smart Chain only marks a revenue of $39.67K. Avalanche, the one with the fifth highest TVL among the top five, registers just $24.36K in revenue.
In terms of volume also, Ethereum dominates with $2.215B. Solana closely follows with $1.129B. BNB Smart Chain and Avalanche exhibit $545.23M and $45.99M volume, respectively. Bitcoin, with just $237.88K volume, is in the fifth position.
Let’s consider the fees index. Ethereum, with $8.06M, dominates in this parameter as well. Solana and Bitcoin follow with $1.87M and $1.56M fees, respectively. BNB Smart Chain has a fees of $398.21K, and Avalanche has $24.36K.
3.1.2. Top Layer 2 Chains Economic Activity Analysis
| Layer 2 Blockchains | Revenue | Fees | Volume | TVL |
| Arbitrum One | $142.69K | $146.64K | $710.1M | $3.136B |
| Blast | N/A | N/A | $27.71M | $1.965B |
| Base | $208.4K | $209.34K | $373.23M | $1.768B |
| Polygon POS | $3.71K | $27.19K | $62.16M | $984.56M |
| Optimism | $67.94K | $68.91K | $124.61M | $891.48M |
Among the top five layer 2 chains by TVL, in terms of revenue, Base, with the third highest TVL of $1.768B TVL, dominates with $208.4K. Arbitrum One, with the highest TVL of $3.136B, follows with $142.69K. Optimism marks a revenue of $67.94K, and Polygon POS records a minimal revenue of $3.71K.
While considering volume, Arbitrum One has an impressive volume of $710.1M. Base also registers a high volume of $373.23M. Optimism reports $124.61M volume, and Polygon POS and Blast register $62.16M and $27.71M, respectively.
When it comes to fees, Base has the highest fees of $209.34K, and Arbitrum One has a high fee of $146.64K. Optimism and Polygon POS follow with $68.91K and 27.19K fees, respectively.
3.2. Blockchain User Interest Analysis
To analyse the user interest of the blockchains, we primarily use the net inflow index, which indicates the amount of new capital entering the blockchain.
A blockchain with the top net inflow index shows high user interest, indicating many people are investing and bringing new capital into it. Positive values indicate increasing user interest and capital inflow, while negative values suggest decreasing interest and capital outflow.
3.2.1. Top Layer 1 Chains User Interest Analysis
| Layer 1 Blockchains | Net Inflow |
| Ethereum | +$2.09M |
| BNB Smart Chain | -$1.13M |
| Solana | N/A |
| Bitcoin | N/A |
| Avalanche | +$7.71M |
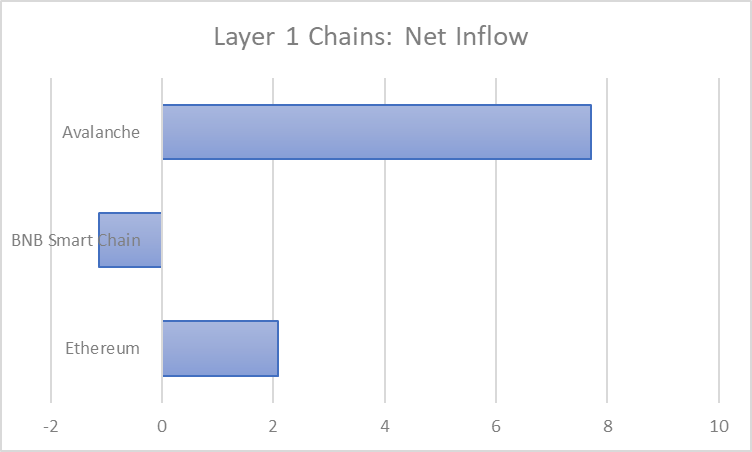
Avalanche has the highest positive net inflow of +$7.71M. Ethereum follows with +$2.09M. Conversely, BNB Smart Chain has a negative net inflow of -$1.13M.
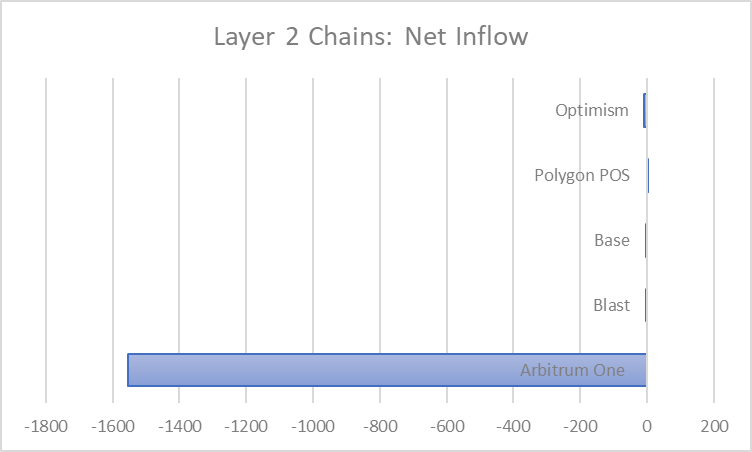
3.2.2. Top Layer 2 Chains User Interest Analysis
| Layer 2 Blockchains | Net Inflow |
| Arbitrum One | -$1.553B |
| Blast | -$0.42M |
| Base | -$3.39M |
| Polygon POS | +$3.94M |
| Optimism | -$7.94M |
Among the top five layer 2 chains by TVL, only Polygon POS shows a positive net inflow; it records a net inflow of +3.94M. Arbitrum One registers the highest negative net inflow of -$1.553B. Optimism, Base and Blast follow with -$7.94M, -$3.39M, and -$0.42M net inflow, respectively.
3.3. Blockchain Development and Innovation Analysis
To do the blockchain development and innovation analysis, we mainly use two indices: commits and core developers. The commits indicator reflects the frequency and extent of code updates, improvements and innovations being made to the blockchains. The core developers indicator speaks about a blockchain’s capacity for sustained development. A higher number of core developers indicates a strong, active and diverse development team.
3.3.1. Top Layer 1 Chains Development and Innovation Analysis
| Layer 1 Blockchains | Commits | Core Developers |
| Ethereum | 12.92K | 381 |
| BNB Smart Chain | 382 | 32 |
| Solana | 254 | 19 |
| Bitcoin | N/A | N/A |
| Avalanche | 2.21K | 40 |
Among the top layer 1 chains, Ethereum shows the highest number of commits of 12.92K and the highest number of core developers of 381. Avalanche follows with 2.21K commits and 40 core developers. BNB Smart Chain records 382 commits and 32 core developers, and Solana reports 254 commits and 19 core developers.
3.3.2. Top Layer 2 Chains Development and Innovation Analysis
| Layer 2 Blockchains | Commits | Core Developers |
| Arbitrum One | 1.57K | 43 |
| Blast | N/A | N/A |
| Base | 313 | 22 |
| Polygon POS | 168 | 17 |
| Optimism | 2.97K | 55 |
Among the top layer 2 chains, Optimism dominates with 2.97K commits and 55 core developers. Arbitrum One follows with 1.57K commits and 43 core developers. Base shows 313 commits and 22 core developers, and Polygon POS displays 168 commits and 17 core developers.
3.4. Blockchain Scalability Analysis
To perform the blockchain scalability analysis, we utilise three indices: Real-Time TPS, Max Recorded TPS and Max Theoretical TPS. Real-Time TPS shows how many transactions per second a blockchain is processing. This metric is calculated by taking different time intervals; here we consider the one month timeframe. Max Recorded TPS records the highest number of transactions per second achieved by a blockchain in its history. Max Theoretical TPS represents how many transactions the blockchain is theoretically capable of handling per second.
3.4.1. Top Layer 1 Chains Scalability Analysis
| Layer 1 Blockchains | Real-Time TPS | Max Recorded TPS | Max Theoretical TPS |
| Ethereum | 13.45 tx/s | 62.34 tx/s | 119 tx/s |
| BNB Smart Chain | 39.94 tx/s | 1,731 tx/s | 2,222 tx/s |
| Solana | 860 tx/s | 1,624 tx/s | 65,000 tx/s |
| Bitcoin | 6.56 tx/s | 12.36 tx/s | 7 tx/s |
| Avalanche | 2.09 tx/s | 92.74 tx/s | 357 tx/s |
Among the top layer 1 chains, Solana has the highest Real-Time TPS of 860 tx/s. BNB Smart Chain follows with 39.94 tx/s. Ethereum, Bitcoin, and Avalanche register just 13.45 tx/s, 6.56 tx/s and 2.09 tx/s, respectively.
Meanwhile, BNB Smart Chain has the highest Max Recorded TPS of 1,731 tx/s. Solana follows with 1,624 tx/s. Avalanche and Ethereum mark impressive values of 92.74 tx/s and 62.34 tx/s, respectively.
Interestingly, Solana has the highest Max Theoretical TPS of 65,000 tx/s. BNB Smart Chain has the second-highest value of 2,222 tx/s. Avalanche and Ethereum mark satisfactory values of 357 tx/s and 119 tx/s. Bitcoin shows a minimal value of 7 tx/s.
3.4.2. Top Layer 2 Chains Scalability Analysis
| Layer 2 Blockchains | Real-Time TPS | Max Recorded TPS | Max Theoretical TPS |
| Arbitrum One | 22.99 tx/s | 532 tx/s | 40,000 tx/s |
| Blast | N/A | N/A | N/A |
| Base | 24.95 tx/s | 293 tx/s | 1,429 tx/s |
| Polygon POS | 46.39 tx/s | 282 tx/s | 649 tx/s |
| Optimism | 6.77 tx/s | 33.47 tx/s | 714 tx/s |
Among the top five-layer 2 chains, Polygon POS has the highest Real-Time TPS of 46.39 tx/s. Base and Arbitrum One closely follow with 24.95 tx/s and 22.99 tx/s, respectively. Optimism records 6.77 tx/s Real-Time TPS.
At the same time, Arbitrum One has the highest Max Recorded TPS of 532 tx/s. Base and Polygon POS follow with 293 tx/s and 282 tx/s, respectively. Optimism displays a minimum value of 33.47 tx/s.
Notably, Arbitrum One has the highest maximum theoretical TPS of 40,000 tx/s. Base, Optimism and Polygon POS follow with 1,429 tx/s, 714 tx/s, and 649 tx/s, respectively.
3.5. Blockchain Latency Analysis
To perform the blockchain latency analysis, we majorly consider two indices: TTF and Block Time. TTF, or Time To Finality, is the duration of time it takes for a transaction to be considered completed in a blockchain network. Block Time is the average amount of time it takes for a new block to be added to a blockchain.
3.5.1. Top Layer 1 Chains Latency Analysis
| Layer 1 Blockchains | TTF | Block Time |
| Ethereum | 16 minutes | 12.08 seconds |
| BNB Smart Chain | 7.5s | 3.01s |
| Solana | 12.8s | 0.46s |
| Bitcoin | 1h | 10m 6s |
| Avalanche | 0s | 2.1s |
Among the top layer 1 chains, Avalanche has the shortest TTF. BNB Smart Chain and Solana follow with 7.5 seconds and 12.8 seconds TTF, respectively. Bitcoin has the longest TTF of 1 hour, and Etheruem the second longest of 16 minutes.
Meanwhile, Solana has the shortest Block Time of 0.46 seconds. Avalanche, BNB Smart Chain and Ethereum follow with 2.1s, 3.01s and 12.08s, respectively. Bitcoin has the longest Block Time of 10 minutes and six seconds.
3.5.2. Top Layer 2 Chains Latency Analysis
| Layer 2 Blockchains | TTF | Block Time |
| Arbitrum One | 16m | 0.25s |
| Blast | N/A | N/A |
| Base | 16m | 2s |
| Polygon POS | 4m 16s | 2.28s |
| Optimism | 16m | 2s |
Among the top five layer 2 blockchains, Polygon POS has the shortest TTF of 4 minutes and 16 seconds. Arbitrum One, Base, and Optimism show the same TTF of sixteen minutes.
At the same time, Arbitrum One has the shortest Block Time of 0.25 seconds. Base and Optimism follow with the same Block Time of two seconds. Polygon POS records the highest Block Time of 2.28 seconds.
3.6. Blockchain Cost Analysis
To do the blockchain cost analysis, we can utilise the Gas Price index. Gas price is the amount of money that users are willing to pay per unit of “Gas.” Gas is a measure of computational effort required to perform a task or transaction on the blockchain.
3.6.1. Top Layer 1 Chains Cost Analysis
| Layer 1 Blockchains | Gas Price (in Gwei) | Gas Price (in USD) |
| Ethereum | 18.0 Gwei | $1.44 |
| BNB Smart Chain | 1.1 Gwei | $0.014 |
| Solana | 22 Gwei | $0.000066 |
| Bitcoin | N/A | N/A |
| Avalanche | 25.0 Gwei | $0.019 |
Among the top layer 1 chains, Solana has the lowest gas price of $0.000066. BNB Smart Chain and Avalanche follow with $0.014 and $0.019, respectively. Ethereum marks the highest gas price of $1.44.
3.6.2. Top Layer 2 Chains Cost Analysis
| Layer 2 Blockchains | Gas Price (in Gwei) | Gas Price (in USD) |
| Arbitrum One | 0.0 Gwei | $0.00096 |
| Blast | 0.0 Gwei | $0.0012 |
| Base | 0.0 Gwei | $0.00095 |
| Polygon POS | 49.0 Gwei | $0.00076 |
| Optimism | 0.1 Gwei | $0.0050 |
Among the top five layer 2 chains, Polygon POS has the lowest gas price of $0.00076. Base and Arbitrum One follow with $0.00095 and $0.00096, respectively. Blast shows a comparatively high gas price of $0.0012. Optimism records the highest gas price of $0.0050.
3.7. Blockchain Market Performance Analysis
To perform the market performance analysis, we generally consider three indices: 30-day change, volume and revenue. The 30-day change index shows the recent performance trend of the blockchain. The volume index indicates the level of trading activity and liquidity. The revenue index reflects the financial health and profitability of the blockchain.
A blockchain with top 30-day change, volume and revenue indicates strong recent performance, high trading activity, and robust financial health.
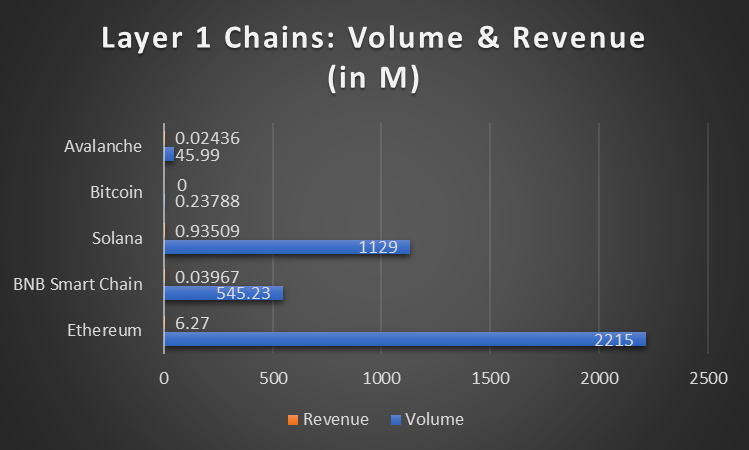
3.7.1. Top Layer 1 Chains Market Performance Analysis
| Layer 1 Blockchains | 30-day Change | Volume | Revenue |
| Ethereum | +23.3% | $2.215B | $6.27M |
| BNB Smart Chain | +5.2% | $545.23M | $39.67K |
| Solana | +28.1% | $1.129B | $935.09K |
| Bitcoin | -2.6% | $237.88K | N/A |
| Avalanche | +7.8% | $45.99M | $24.36K |

Among the top five layer 1 blockchains, only one chain shows a negative 30-day change; Bitcoin marks a negative 30-day change of -2.6%. Solana and Ethereum register high changes of +28.1% and +23.3%, respectively. Avalanche and BNB Smart Chain display moderate change of +7.8% and +5.2%, respectively.
Meanwhile, Ethereum has the highest volume of $2.215B. Solana follows with $1.129B. BNB Smart Chain and Avalanche showcase moderate values of $545.23M and $45.99M, respectively. Bitcoin records a moderate volume of $237.88K.
Notably, Ethereum reports the highest revenue of $6.27M. Solana follows with $935.09K revenue. BNB Smart Chain and Avalanche display minimal values of $39.67K and $24.36K, respectively.
3.7.2. Top Layer 2 Chains Market Performance Analysis
| Layer 2 Blockchains | 30-days Change | Volume | Revenue |
| Arbitrum One | +18.9% | $710.1M | $142.69K |
| Blast | +37.5% | $27.71M | N/A |
| Base | +12.4% | $373.23M | $208.4K |
| Polygon POS | +8.4% | $62.16M | $3.71K |
| Optimism | +2.0% | $124.61M | $67.94K |
Among the top five layer 2 chains, all of them show a positive 30-day change. Blast marks the highest 30-day change of +37.5%. Arbitrum One and Base follow with +18.9% and +12.4%, respectively. Polygon POS exhibits +8.4% change. Optimism showcases the smallest 30-day change of +2.0%.
At the same time, Arbitrum One exhibits the highest volume of $710.1M. Base and Optimism follow with 373.23M and 124.61M, respectively. Polygon POS and Blast display $62.16M and $27.71M, respectively.
Interestingly, Base has the highest revenue of $208.4K. Arbitrum One and Optimism follow with $142.69K and 67.94K, respectively. Polygon POS exhibits the lowest revenue of $3.71K.
Endnote
Thank you for reading our Blockchain Monthly Report for May 2024. We aim to offer a clear and thorough understanding of the blockchain landscape. By leveraging reliable sources and cutting-edge methodologies, we provide detailed insights. We hope this report aids your decision-making and deepens your knowledge of the blockchain sector.